
Figure 3.
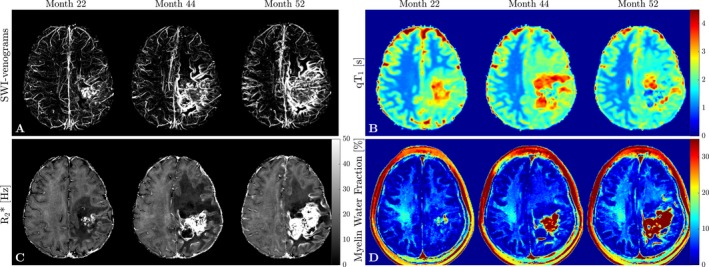
Summary of quantitative MRI findings. (A) Minimum intensity projections of SWI‐Venograms demonstrate an increasing venous involvement and thrombus in the AVM; (B) qT 1 maps representative of changes in water content show an increase in qT 1 in line with the presence of edema at month 44 and recovery at month 52 in the anterior frontal WM region of interest; (C) R2* decreased in the left anterior frontal WM at first and recovered at month 52. Note also the clear depiction of the overall involvement of the left hemisphere; (D) In line with the observed qT 1 and R2* changes, MWF maps show an initial decrease in the left anterior frontal WM at month 44 and subsequent partial recovery likely due to resolution of edema.