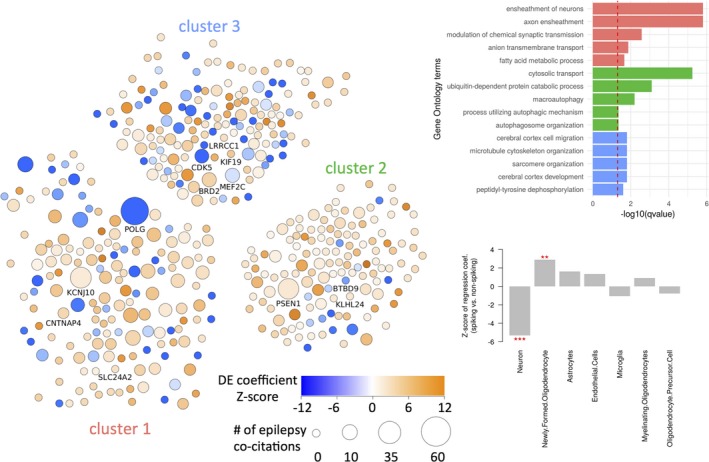
Figure 2.

Network analysis and cell‐type changes in spiking bulk tissue. Differentially expressed genes were analyzed and clustered as a STRING network of proteins (A). Nodes are colored by the Z‐score of their differential expression coefficients, and sized relative to the number of times they are cited within the epilepsy literature. Labeled nodes are either highly cited or highly interconnected within the network and also contained within one of the top five gene sets annotated to the associated cluster. Each cluster was subject to functional enrichment analysis using the Gene Ontology (B), with only the top five terms reported. Using gene expression from purified cell samples, we inferred the relative abundance (w.r.t. nonspiking tissue) of cells types in spiking tissue. ***P < 0.001; **P < 0.01 (C).
