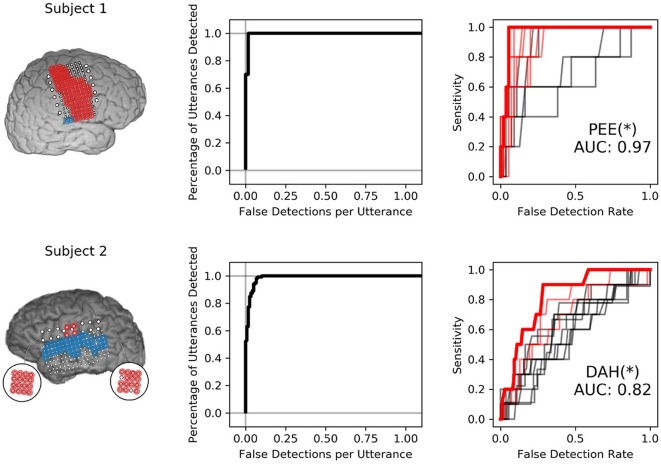
Figure 5.
Isolated VAD and keyword discriminability for two subjects. The left-most panel shows the electrodes highlighted in red and blue that were used to discriminate syllables. Only electrodes highlighted in red were used to perform VAD. The center panel shows the VAD performance in sensitivity (percentage of utterance timings correctly identified) against the number of false detections per utterance for various VAD thresholds. The right-most panel shows ROC curves for all 12 keyword detectors. ROC curves with AUC values were significant at the 95% confidence interval are highlighted in red. The keyword detector that produced the highest AUC is highlighted in bold-red and indicated via annotation under the curves, followed by an asterisk that indicates significance at the p < 0.05 level with respect to the distribution of maximum AUC models.

