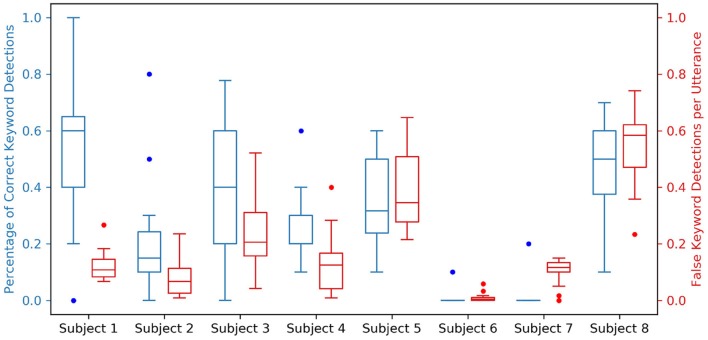
Figure 6.
Simulated keyword spotting performance on the testing dataset for all spotters across all subjects. For each subject, two boxplots relating the performance of all 12 keyword spotters are shown; a blue boxplot to the left indicating the percentage of correct keyword detections with a value ideally closer to 1.0, and a red boxplot to the right indicating the percentage of false keyword detections per utterance with a value ideally closer to 0.0. These performance metrics are coupled to neural VAD performance, which is shown in the Supplementary Material for all subjects.

