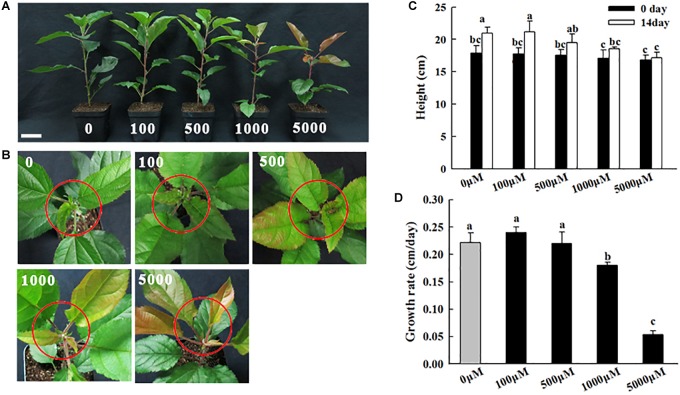
FIGURE 1.
Phenotypes of apple plants under different concentrations of melatonin treatment (0, 100, 500, 1,000, and 5,000 μM). (A) Growth performance, (B) shoot tip phenotypes, (C) stem height, and (D) growth rate were recorded after 14 days of treatment. The plant height was considered the average of 6 plants per treatment. The red circles indicate the shoot tips. Values are means of four replicates SD. Different letters above the column indicate significant difference at P < 0.05 by Duncan’s test. Scale bars represent 5 cm.

