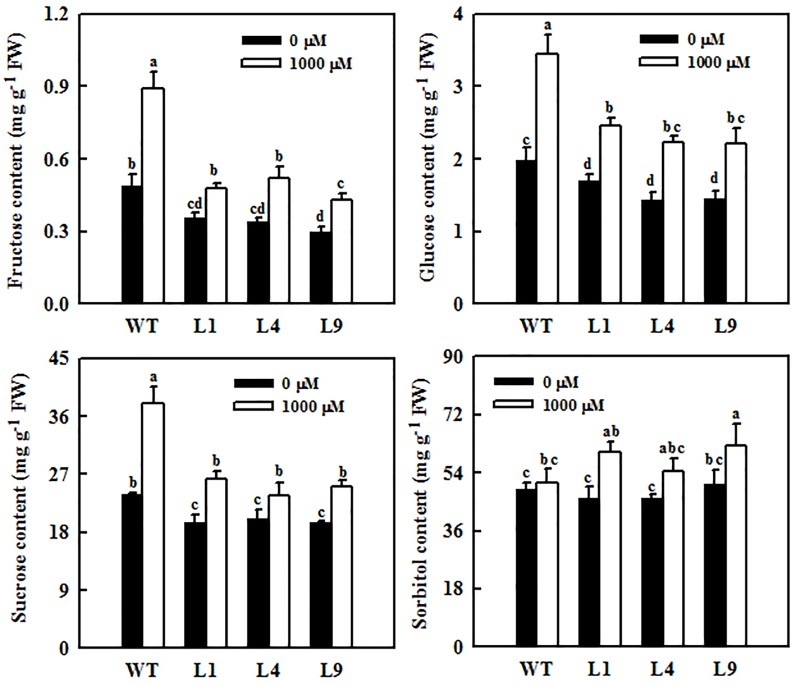
FIGURE 7.
Changes in sugar concentrations in mature leaves of WT and transgenic apple plants overexpressing MdFRK2. Both WT and the transgenic plants were treated with 0 μM of melatonin (control) or 1,000 μM of melatonin for 14 days. Values are means of four replicates ± SD. Different letters above the column indicate significant difference at P < 0.05 by Duncan’s test.

