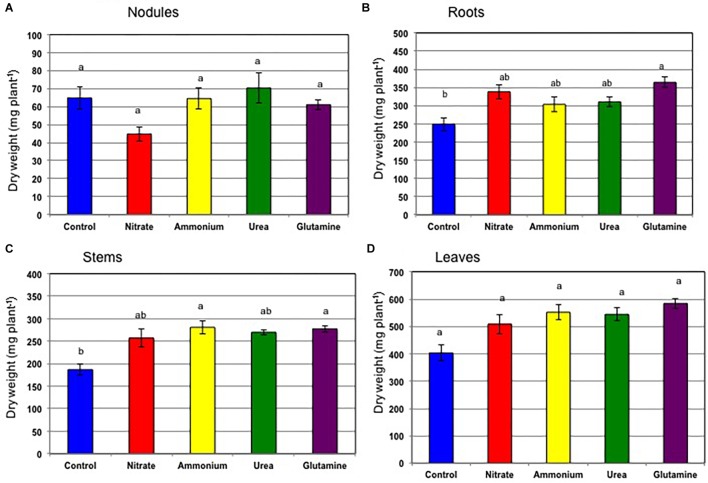
FIGURE 4.
Comparison of the dry weight of each plant tissue on 24 DAP for treatment with control (N-free), nitrate, ammonium, urea, or glutamine from 12 to 17 DAP, thereafter cultivated with a N-free culture solution (Experiment 2). (A) Nodules. (B) Roots. (C) Stems. (D) Leaves. Averages and standard errors are shown (n = 4). Different letters above the column indicate significant differences at <0.05 by Tukey’s test.

