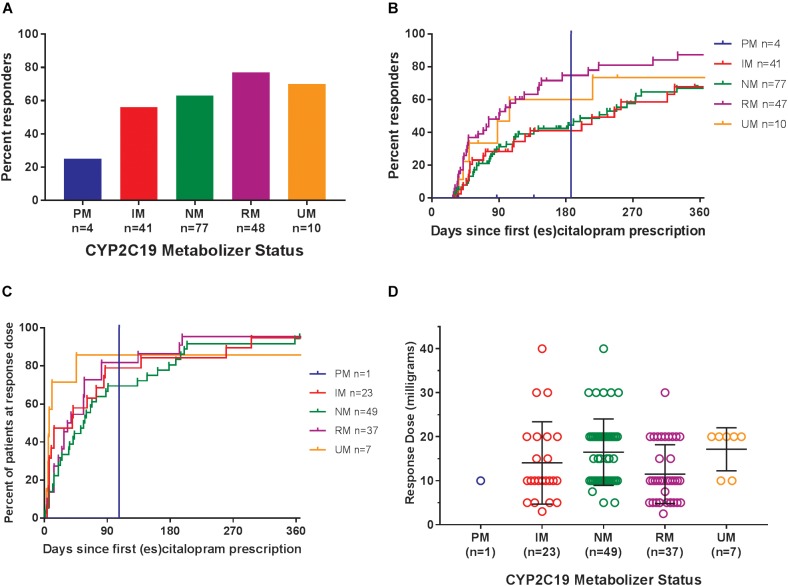
FIGURE 4.
(A) Percentages of patients in the response analysis who achieved or did not achieve a response while prescribed es/citalopram (p = 0.12, χ2). (B) Time to response was associated with CYP2C19 metabolizer status (p = 0.005, log-rank test for trend). (C) Time to response dose among patients who achieved a response was not different by CYP2C19 metabolizer status (p = 0.27, log-rank test for trend). (D) Response dose was not associated with CYP2C19 metabolizer status (p = 0.67, one-way ANOVA with test for trend). Mean and standard deviation are indicated by the bar and whiskers. PM, poor metabolizer; IM, intermediate metabolizer; NM, normal metabolizer; RM, rapid metabolizer; UM, ultrarapid metabolizer; n, number.

