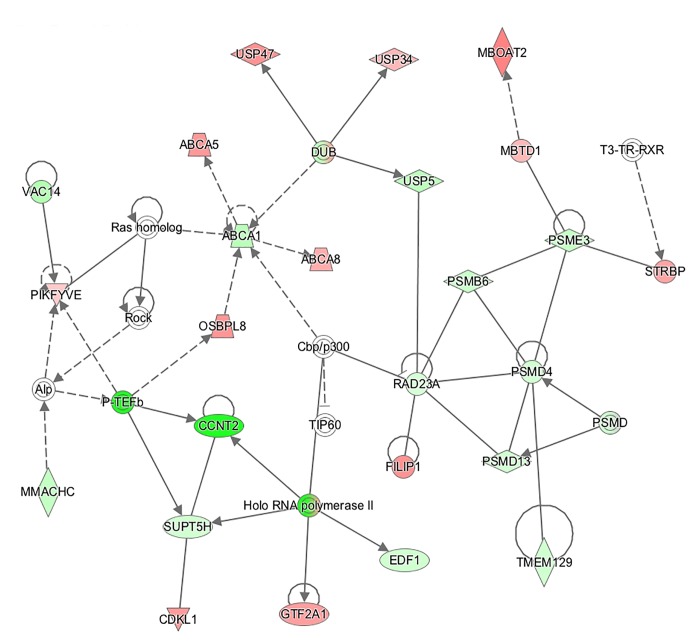
Figure 3.
Connection of genes affecting functions related to “carbohydrate metabolism,” “lipid metabolism,” and “small molecule biochemistry” represented in a gene network (network 12). Biological relationship between genes is depicted as an edge/line (solid lines and dashed lines show direct and indirect interactions, respectively). Colors represent up- (red) and down- (green) regulated genes in high-feed efficient pigs.

