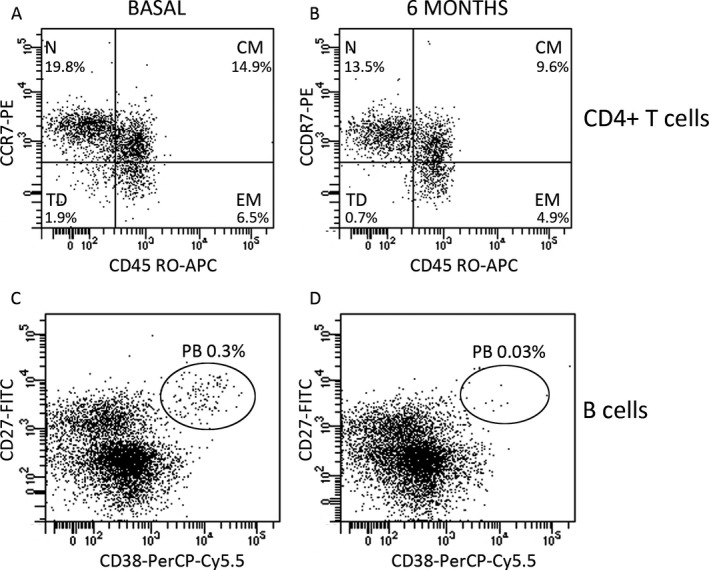
Figure 2.

Dot plots showing CD4+ T cells (A and B) and B cells (C and D) at basal state (A and C) and after 6 months of treatment (B and D). Plots are gated on CD4 T cells (A and B) and B cells (C and D). Naïve (N), central memory (CM), effector memory (EM) and terminally differentiated cells (TD) were studied according to their differential membrane expression of CD197 (CCR7) and CD45RO. Plasmablasts (PB) were studied according to their differential membrane expression of CD27 and CD38. Percentages showed in the plots are referred to total peripheral blood mononuclear cells.
