
Figure 3.
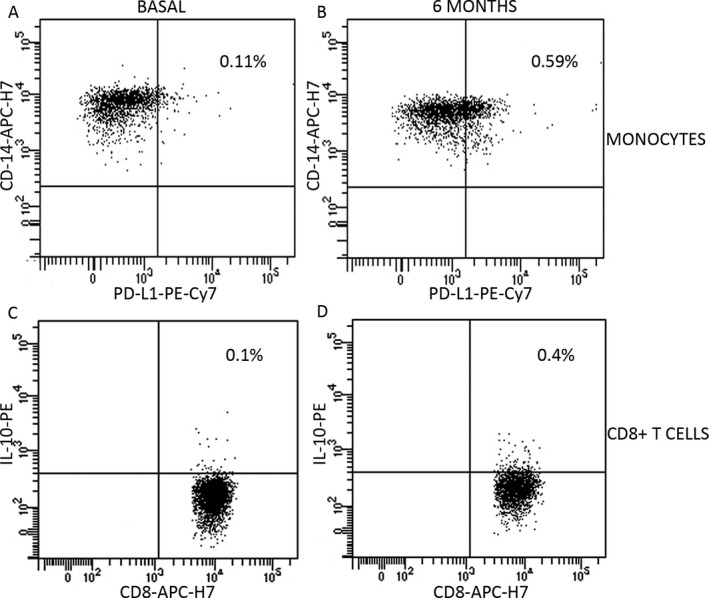
Dot plots showing membrane expression of PD‐L1 on monocytes (A and B) and intracellular expression of IL‐10 on CD8+ T cells (C and D) at basal state (A and C) and after 6 months of treatment (B and D). A and B plots are gated on monocytes (CD14+ cells); C and D plots are gated on CD8+ T cells. Percentages are referred to total peripheral blood mononuclear cells.