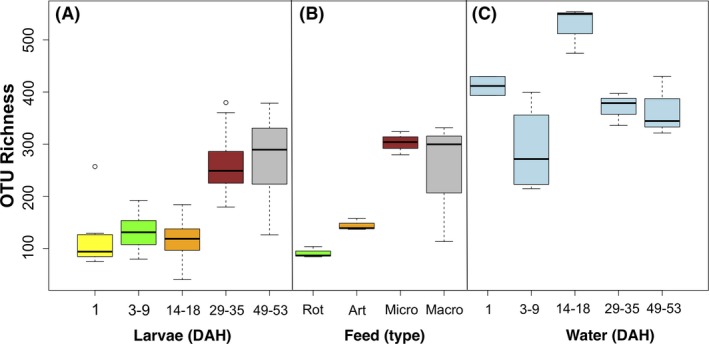
Figure 3.

OTU richness: the average number of observed OTUs in (A) the larval microbial community throughout developmental stages, (B) the different feed types, (C) the rearing water during larval development. Colour of larvae (A) corresponds to colour of feed (B) at that stage. Significant differences (assessed by ANOVA with post hoc Turkey's HSD) between samples are indicated with an asterisk (*) *** P > 0.001; ** P < 0.001 > 0.01; * P < 0.01 > 0.05.
