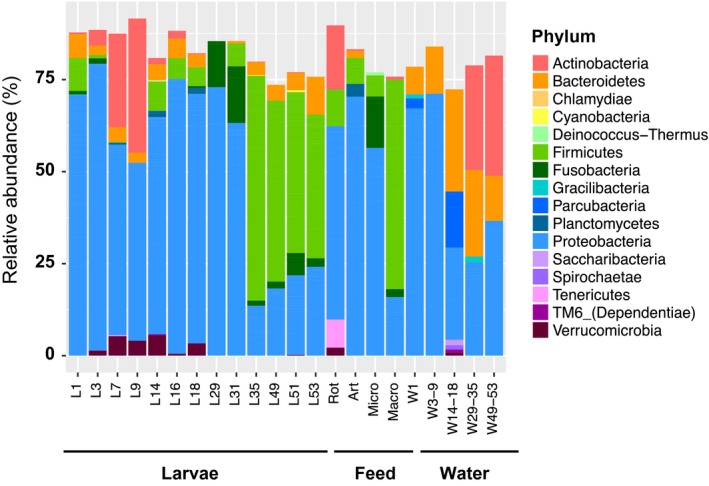
Figure 5.

Phylum‐level bacterial taxonomic composition in the S. lalandi larviculture system. Relative abundances were calculated using a rarefied library (10 000 sequences per sample), and replicate samples were pooled into sample groups as presented on the x‐axis. Relative abundances are only shown for taxa representing > 1% of the rarefied data set sequences.
