
Figure 6.
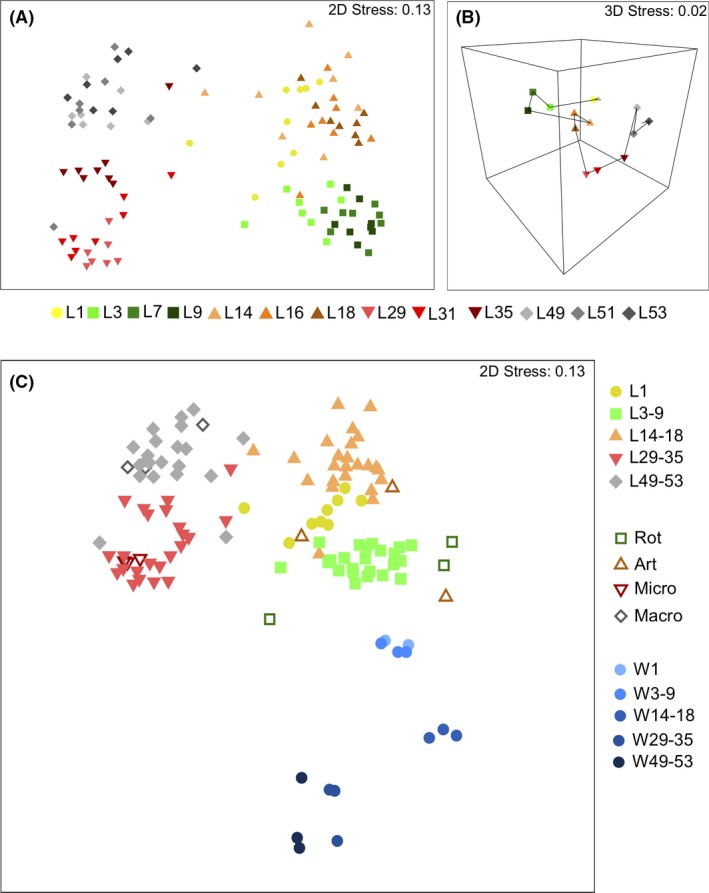
Non‐metric multidimensional scaling (nMDS) plots of: (A) Bray–Curtis distances in 2D of the larval intestinal microbiome across all developmental stages (L1 to L53). Each point represents individual larvae from its respective stage. (B) Bray–Curtis distances in 3D showing the trajectory (as indicated by arrows) of the larval intestinal microbiome over the duration of sampling. Each point represents eight replicate samples grouped into stage categories. Note the direction and length of the trajectory indicate difference. (C) Bray–Curtis distances of all samples in 2D, including larvae and both feed and rearing water. Feed samples are shown with hollow symbols (shape respective of related larval stage), and water samples with blue symbols (circles). Each point represents an individual sample.