
Figure 7.
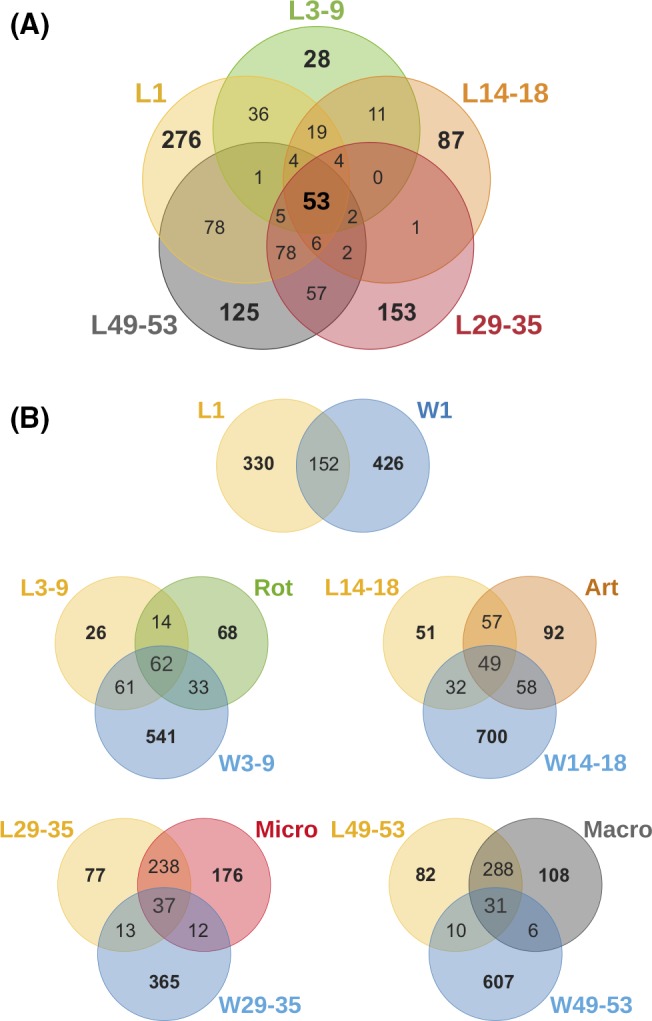
Venn diagrams were constructed exploring rarefied libraries of detected OTUs. Replicate samples were pooled to represent the total number of bacterial phylotypes identified with each sample category.
A. displays the extent of shared and exclusive OTUs between S. lalandi larvae at their five developmental stages.
B. displays the extent of shared and exclusive OTUs between S. lalandi larvae or early juveniles (L), the rearing water (W) and the feed (Rot, Art, Micro & Macro).