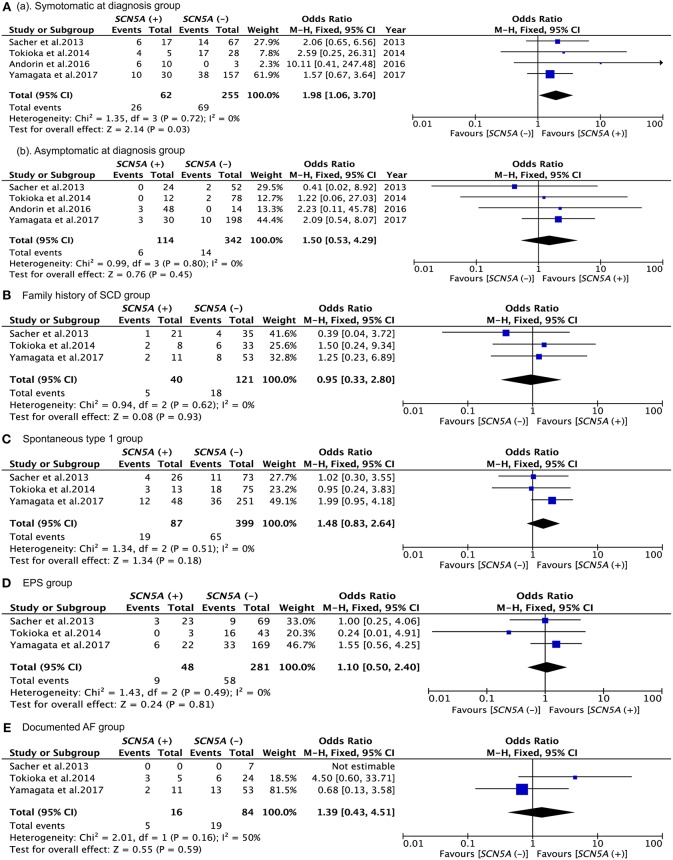
Figure 3.
Forest plots comparing outcomes of subgroups. (Aa) Comparison between events of SCN5A (+) and SCN5A (–) in symptomatic at diagnosis group; (Ab) comparison between events of SCN5A (+) and events of SCN5A (–) in asymptomatic at diagnosis group; (B) comparison between events of SCN5A (+) and SCN5A (–) in family history of SCD group; (C) comparison between events of SCN5A (+) and SCN5A (–) in spontaneous type 1 group; (D) comparison between events of SCN5A (+) and SCN5A (–) in EPS group; (E) comparison between events of SCN5A (+) and SCN5A (–) in documented AF group.

