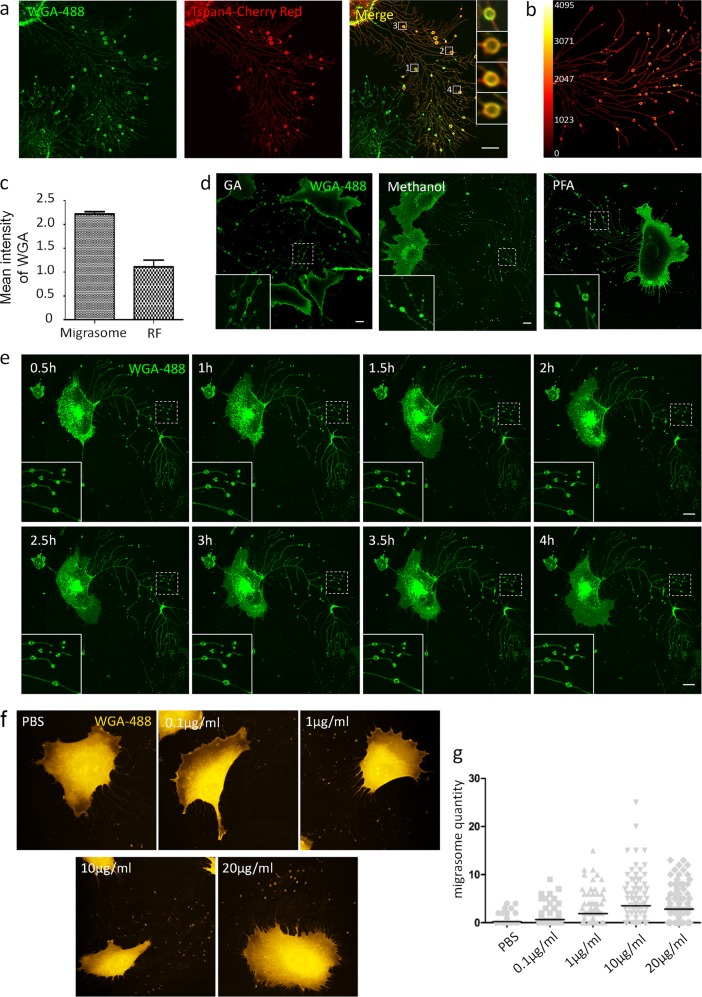
Fig. 1. Detection of migrasomes by WGA.
a L929 cells were transfected with Tspan-mCherry and cultured for 12 h, then stained with 1 μg/ml WGA-Alexa 488. Cells were observed by confocal microscopy. Scale bar, 10 μm. b L929 cells were stained with 1 μg/ml WGA-Alexa 488. Cells were observed by confocal microscopy. Enrichment of WGA-Alexa 488 on migrasomes was revealed by fluorescence intensity heat mapping. c Cells from a were measured for WGA-Alexa 488 fluorescence intensity in migrasomes and retraction fibers by the Olympus FLUOVIEW Ver.2.0b Viewer software; n = 450 migrasomes/retraction fibers (RFs) from three independent experiments. t test, P < 0.0001. Error bars indicate mean ± SD. d L929 cells were fixed with 2.5% glutaraldehyde, methanol, or 4% paraformaldehyde, then stained with WGA-Alexa 488. Cells were observed by confocal microscopy. Scale bar, 10 μm. e L929 cells were stained with 1 μg/ml WGA-Alexa 488, which was present in the medium during imaging. Images were captured every 30 min for 4 h. f L929 cells were cultured for 12 h on microwell plates coated with different concentrations of fibronectin, then fixed with 2.5% glutaraldehyde and stained with WGA. Images were taken with the Opera Phenix system. g The number of migrasomes per cells with different concentrations of fibronectin in f

