Fig. 4.
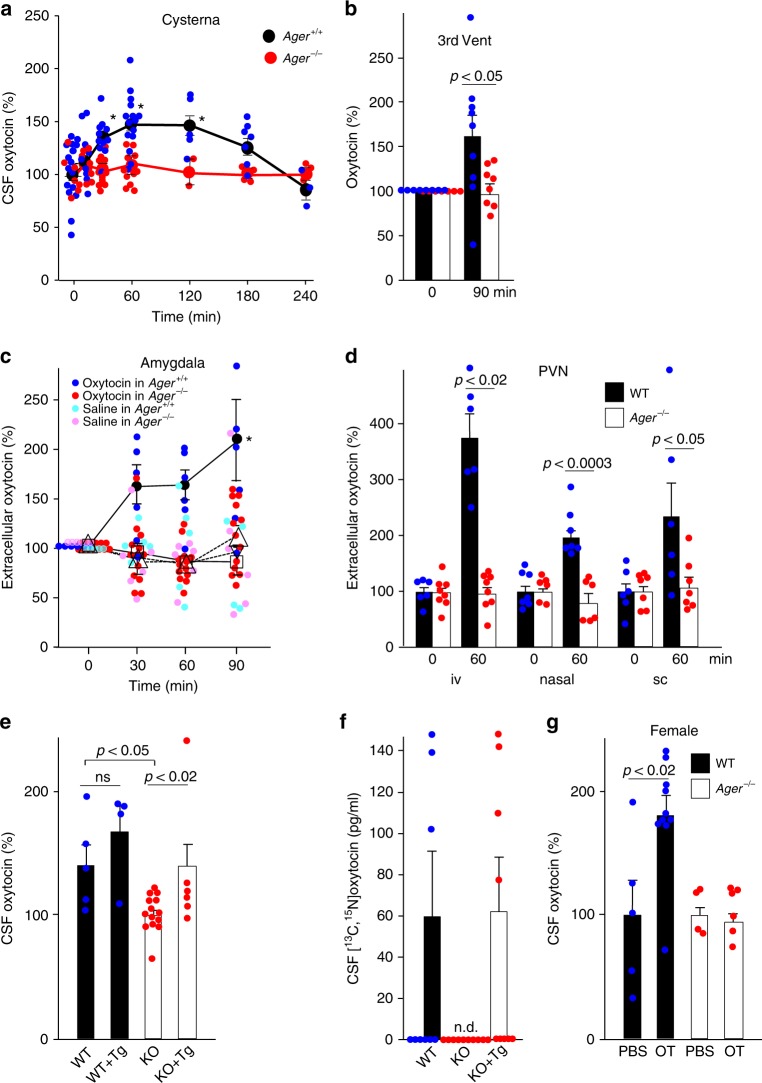
Transport of oxytocin into the brain. a Oxytocin concentrations in CSF from the cisterna magna after subcutaneous injection of 30 ng oxytocin in WT (Ager+/+) or Ager−/− male mice (n = 3–15/data point, *p < 0.05). b Oxytocin concentrations in the CSF of the third ventricles before and 90 min after subcutaneous administration of oxytocin (30 ng) (n = 7–9). c Oxytocin concentrations in microperfusates of the amygdala before and after intranasal (20 ng) oxytocin. Closed circles, oxytocin in WT mice; open triangles, oxytocin in Ager−/− mice; inverted open triangles, saline in WT mice; open squares, saline in Ager−/− mice (n = 4–13; *p < 0.05). d Oxytocin concentrations in microperfusates of the paraventricular nuclei (PVN) of WT mice before and 60 min after intravenous (iv), nasal (in) or subcutaneous (sc) administration of oxytocin (n = 6–8). e, f Transgenic (Tg) mice expressed human RAGE selectively in endothelial cells either on WT or Ager−/− (KO) backgrounds. Oxytocin concentrations in the CSF were measured 60 min after subcutaneous injections of oxytocin (e; n = 4–14) or [13C,15N]oxytocin (f; n = 9–10). g Oxytocin concentrations in the CSF of female mice were measured 60 min after subcutaneous injections of oxytocin (OT) (n = 4–10). n.d., not detected; ns, not significant. Values are mean ± SEM

