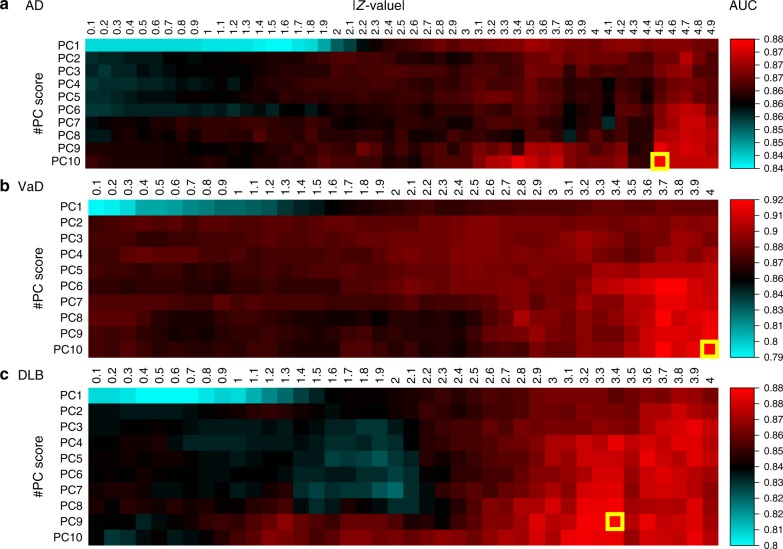
Fig. 2.
Risk prediction models using 10-fold cross-validation on a discovery cohort. The x and y axes show the cutoff value of the z-value in the logistic regression (T) and the number of top principal component (PC) scores used (m) for the prediction models, respectively. In AD (a), a combination of (T, m) = (4.5, 10) achieved the highest AUC of 0.877 in the discovery cohort. In VaD (b), a (T, m) = (4.0, 10) achieved an AUC = 0.923, and in DLB (c), a (T, m) = (3.4, 9) achieved an AUC = 0.885. AUC area under the curve, AD Alzheimer’s disease, VaD vascular dementia, DLB dementia with Lewy bodies

