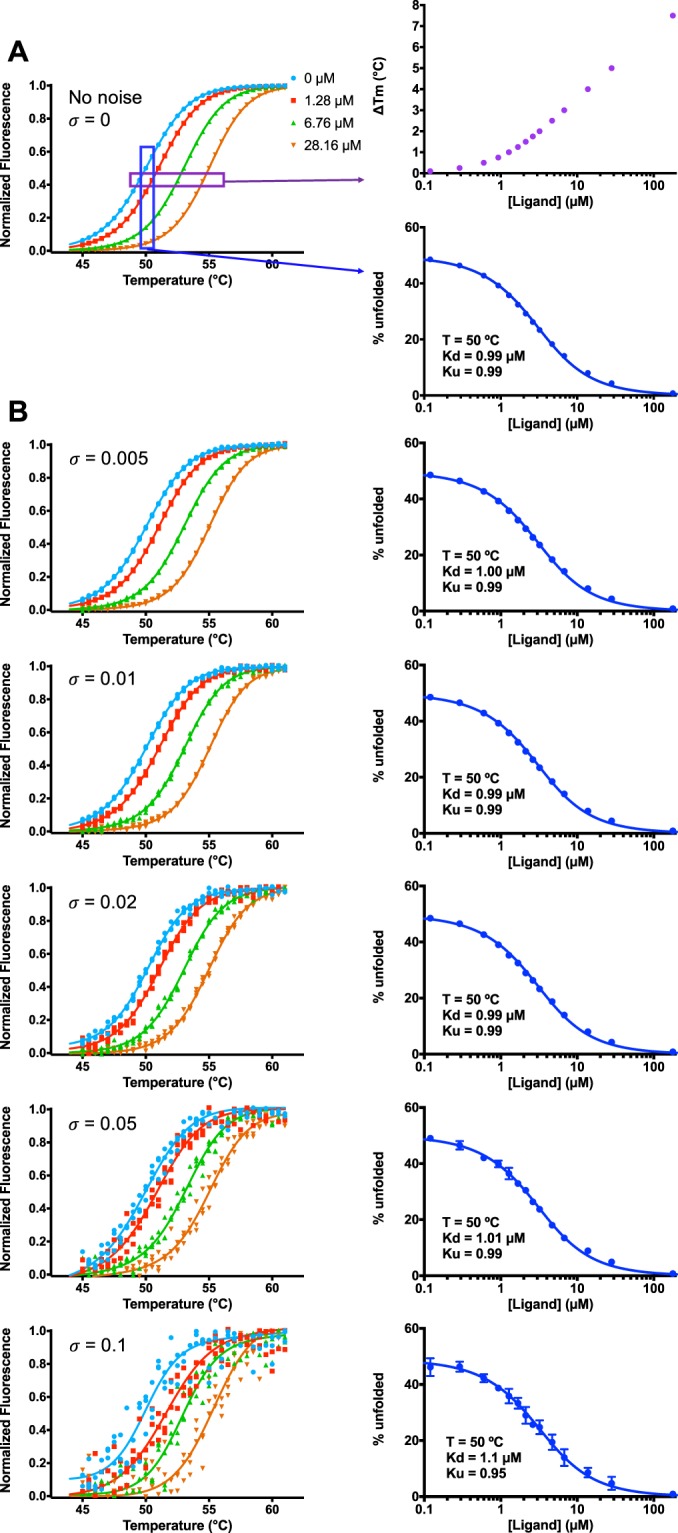
Figure 2.

Simulations to explore the consistency and robustness of isothermal analysis. (A) Simulated thermal unfolding curves were generated using a thermodynamic model for unfolding and binding. Parameters were set as follows: Tm = 50 °C, KdTm = 1 µM, ΔHUTm = 120 kcal mol−1, ΔHbTm = −10 kcal mol−1, ΔCpUTm = 4 kcal mol−1 K−1, ΔCpbTm = −0.5 kcal mol−1 K−1, and total protein concentration = 2 µM. By definition, KUTm = 1. Fitting this simulated data using the simpler isothermal approach yields KUTm = 0.99, and KdTm = 0.99 µM. (B) Upon addition of increasing random noise to the simulated unfolding data, the isothermal approach still leads to accurate estimates of KUTm and KdTm, up to values exceeding the noise typically present in real experimental data.
