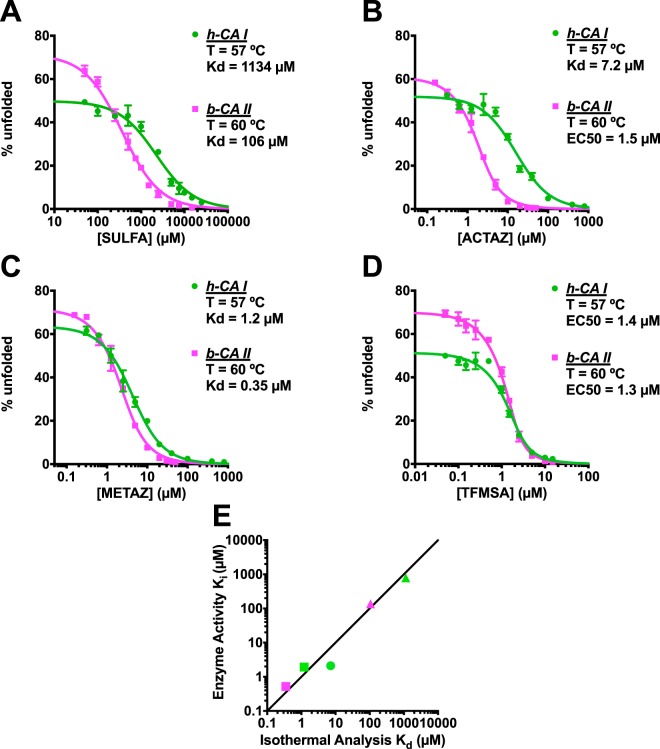
Figure 5.
Determination of binding affinities for carbonic anhydrase inhibitors using isothermal analysis of thermal unfolding data. Each inhibitor was characterized with two carbonic anhydrase isoforms, h-CA I (green) and b-CA II (pink). (A) Analysis of SULFA yielded binding constants of 1.1 mM and 0.1 mM for isoforms h-CA I and b-CA II. (B) ACTAZ gave binding constants of 7.2 µM for h-CA I and 1.5 µM as EC50 for b-CA II. (C) METAZ gave binding constants of 1.2 µM and 0.35 µM for the two isoforms. (D) TFMSA gave EC50 of 1.4 µM and 1.3 µM for the two isoforms. (E) Comparison of the binding constants obtained from isothermal analysis of thermal unfolding data versus inhibition constants obtained in an enzyme inhibition activity. The TFMSA/h-CA I, TFMSA/b-CA II and ACTAZ/b-CA II pairs are not included here, because they all have less than 2 µM EC50. All experiments were carried out in triplicate.

