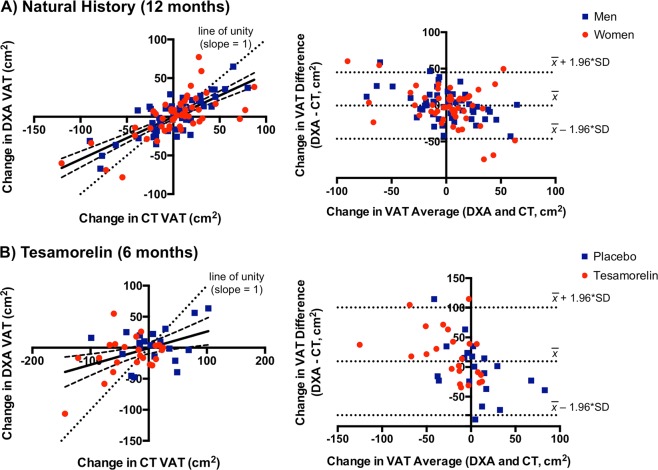
Fig. 4. Comparison of DXA and CT for longitudinal VAT measurement in HIV.
a In the natural history analysis of individuals with HIV, changes in VAT over 12 months by CT and DXA are well-correlated (r = 0.74, P < 0.0001). However, the regression line (shown with 95% confidence bands) deviates from the dotted line of unity (P < 0.05) such that DXA underestimates a gain or loss of VAT as measured by CT. The Bland–Altman plot comparing changes in VAT over 12 months between DXA and CT is also shown. Measurement bias (DXA–CT) is positive among individuals with VAT loss and negative among individuals with VAT gain (P < 0.0001), which again suggests that VAT gain and loss are both underestimated by DXA. Horizontal dotted lines denote the mean difference between DXA and CT in change in VAT over time and the expected 95% limits of agreement. Measurement bias between DXA and CT does not differ between men (blue squares) and women (red circles). b The tesamorelin analysis similarly shows that DXA underestimates changes in VAT over 6 months relative to CT. The extent of underestimation is comparable between individuals treated with tesamorelin (red circles) or placebo (blue squares)

