Fig. 1.
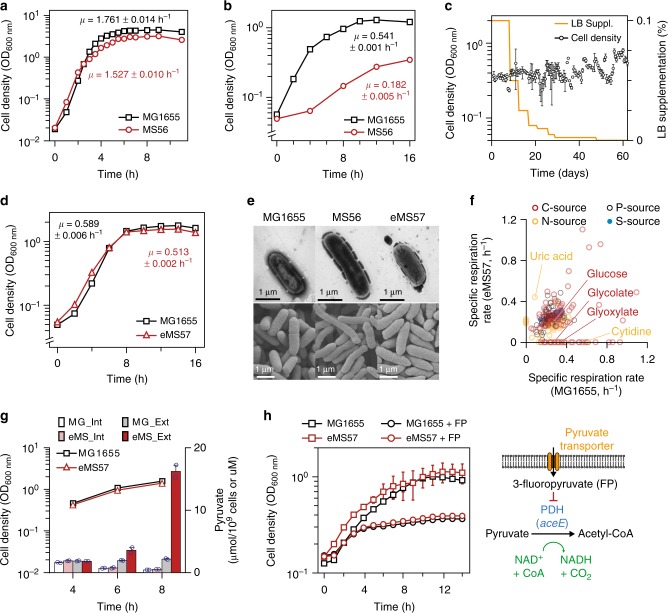
Adaptive laboratory evolution (ALE) of a genome-reduced strain (MS56). a Growth profiles of genome-reduced strain MS56 (red line) and wild-type E. coli MG1655 (black line) in LB medium. μ indicates specific growth rate. Error bars indicate standard deviation (s.d.) of two biological replicates. b Growth profiles of genome-reduced strain MS56 (red line) and wild-type E. coli MG1655 (black line) in M9 minimal medium. Error bars indicate s.d. of three biological replicates. c Cell growth trajectory showing changes in fitness during the ALE of MS56 in M9 minimal medium with supplementation of LB medium. Cell density was measured after 12 h of three individual batch cultivation (circles) and error bars indicate the s.d. of three individual cultures. LB supplementation was stepwise reduced from 0.1 to 0% over time (orange line). At the end of the ALE experiment, the evolved population exhibited restored growth rate in M9 minimal medium without any nutrient supplementation. d Growth profiles of a clone eMS57 (red line) isolated from the ALE population and wild-type E. coli MG1655 (black line) in M9 minimal medium. Error bars indicate s.d. of three biological replicates. e Morphological changes between MG1655, MS56, and eMS57. Upper panel, TEM images. Lower panel, SEM images. f Phenotype microarray characterization of MG1655 and eMS57 showing different nutrient utilization capability. Various carbon sources (red circle), phosphorus sources (black circles), nitrogen sources (yellow circles), and sulfur sources (blue circles). g Intracellular and extracellular pyruvate concentrations for MG1655 and eMG57 at 4, 6, and 8 h after inoculation. Int: intracellular pyruvate concentration. Ext: pyruvate concentration in the medium. Black (MG1655) and red (eMS57) lines show cell density at 4, 6, and 8 h after inoculation. Intracellular pyruvate level is presented as mole pyruvate per 109 cells and extracellular pyruvate level was measured in molar concentration. Individual data points are shown as blue circles and error bars indicate the s.d. of two biological replicates. h Pyruvate uptake function in MG1655 and eMS57 was examined by growth inhibition induced by a toxic pyruvate analog (3-fluoropyruvate, FP). Error bars indicate s.d. of three biological replicates. Source data are provided as a Source Data file

