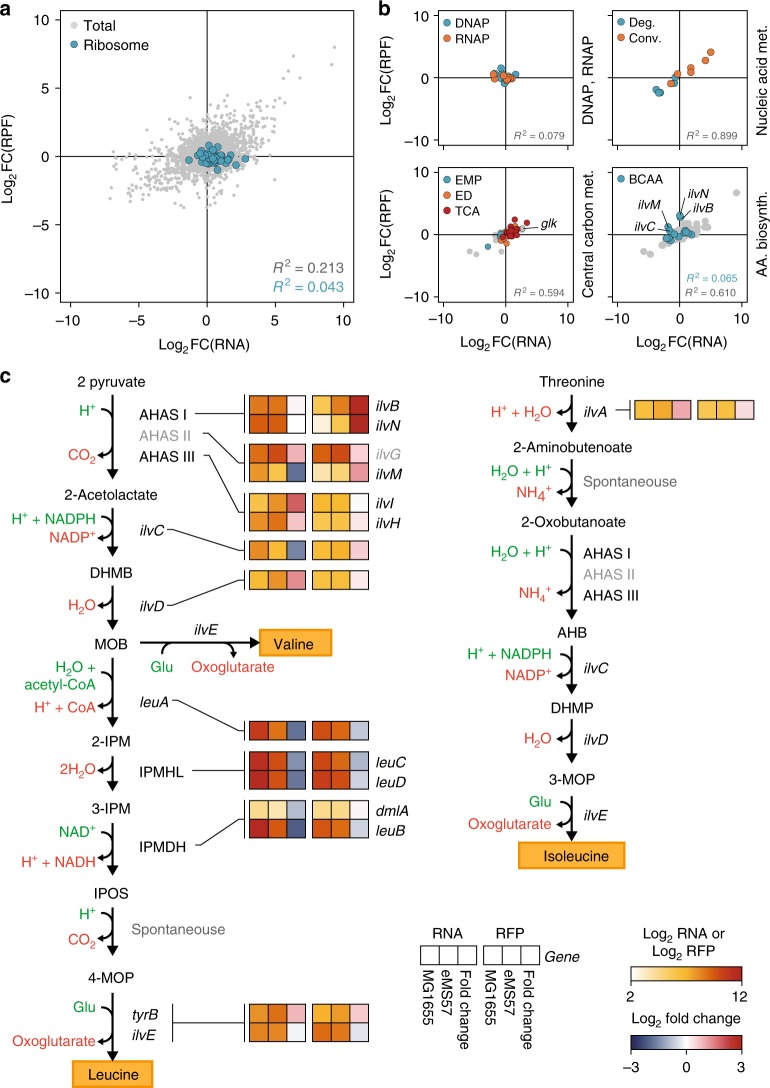
Fig. 4.
Post-transcriptional changes in eMS57 analyzed by ribosome profiling. a Correlation between translation and transcription changes in eMS57 compared to that in MG1655. Translational changes in eMS57 generally showed a weak correlation with transcriptional change (Total, Pearson’s r2 of 0.213). Transcription of ribosomal proteins was upregulated, whereas translation remained relatively unchanged. Each dot indicates a gene. Pearson’s correlation constants (r2) between transcription and translational changes in total genes (gray dots) and ribosome (blue dots) are presented. FC: fold change (eMS57/MG1655). b Correlation between transcription and translation changes in DNA synthesis machinery (DNAP), transcription machinery (RNA polymerase), nucleic acid metabolism, central carbon metabolism, and amino acid biosynthetic pathway. No changes were observed in the transcriptional and translational levels of DNA synthesis and transcription machinery. Translation of genes responsible for nucleic acid and central carbon metabolism correlated linearly to transcriptional change. BCAA biosynthetic genes were translated differently than transcription in eMS57. Each dot indicates a gene and dots are colored by their function or pathway. Correlation between transcription and translational changes were examined by Pearson’s correlation (r2). FC: fold change (eMS57/MG1655). c Transcription and translation level of BCAA biosynthesis pathway. Translation of valine-resistant acetohydroxy acid synthase I (AHAS I) were markedly upregulated in eMS57. DHMB: 2,3-dihydroxy-3-methylbutanoate, MOB: 3-methyl-2-oxobutanoate, 2-IPM: 2-isopropylmalate, IPOS: 2-isopropyl-3-oxosuccinate, 4-MOP: 4-methyl-2-oxopentanoate, AHB: 2-aceto-2-hydroxybutanoate, DHMP: 2,3-dihydroxy-3-methylpentanoate, 3-MOP: 3-methyl-2-oxopentanoate, IPMHL: isopropylmalate hydrolyase, IPMDH: isopropylmalate dehydrogenase. Metabolites colored green and red are consumed and produced by given enzymatic reaction, respectively

