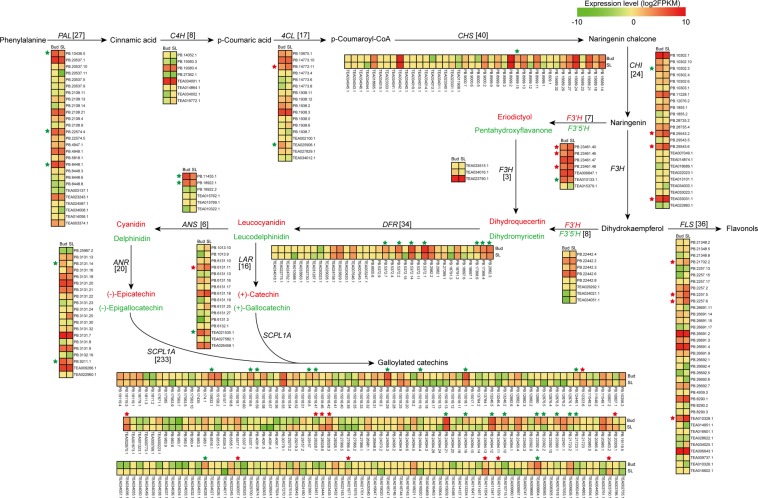
Figure 4.
The flavonoid biosynthetic pathway in tea plants. The numbers in brackets following or under of each gene name indicate the number oftranscripts identified in this study. The expression levels of the transcripts in the two tissues are represented by heat maps. PAL, phenylalanine ammonia-lyase; C4H, cinnamic acid 4-hydroxylase; 4CL, 4-coumarate-CoAligase; CHS, chalcone synthase; CHI, chalcone isomerase; F3H, flavanone 3-hydroxylase; F3′H, flavonoid 3′-hydroxylase; F3′,5′H, flavonoid 3′,5′-hydroxylase; FLS, flavonol synthase; DFR, dihydroflavonol 4-reductase; ANS, anthocyanidin synthase; ANR, anthocyanidin reductase; LAR, leucocyanidin reductase; SCPL1A, type 1A serine carboxypeptidase-like acyltransferases.

