Fig. 3.
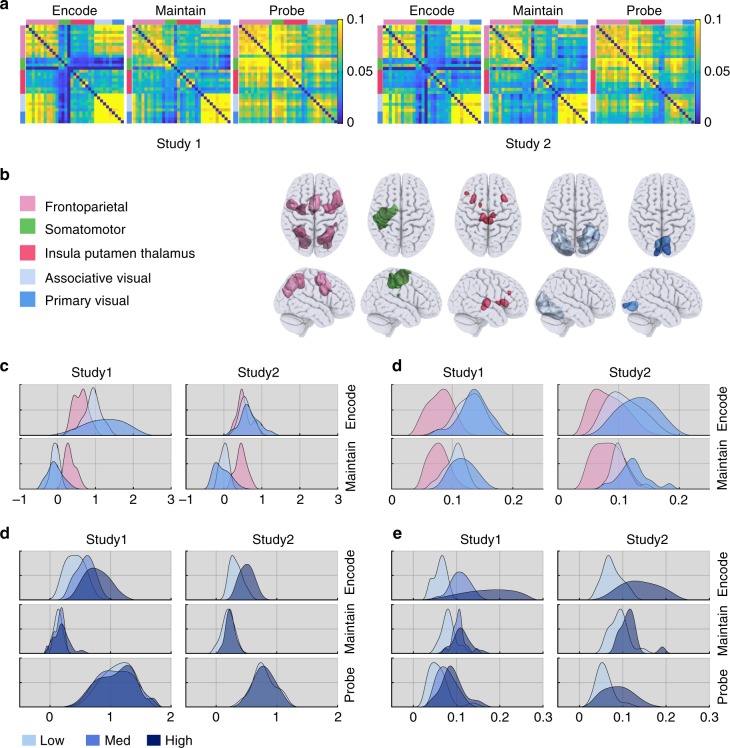
Comparing bold activity and functional connectivity across experiments. a Mean functional connectivity matrices during encoding, maintenance and probe for the two studies. Connectivity matrices were sorted based on the previously defined functional clusters. Distributions across participants of mean DG ROI activity (b) and intra-cluster functional connectivity (c) during encoding and maintenance relative to the ITI. Colours represent frontal and visual clusters (FPT, AVS and PVS). All clusters were active during encoding but only the FPT cluster was active during maintenance. All clusters showed significant FC during both encoding and maintenance. Distributions across participants of DG ROI activity (d) and intra-cluster functional connectivity (e) averaged across ROI cluster and broken down by load. Activity was increased at higher loads during encoding but not during maintenance or probe. In contrast, intra-cluster FC was upregulated at higher WM load during all three stages

