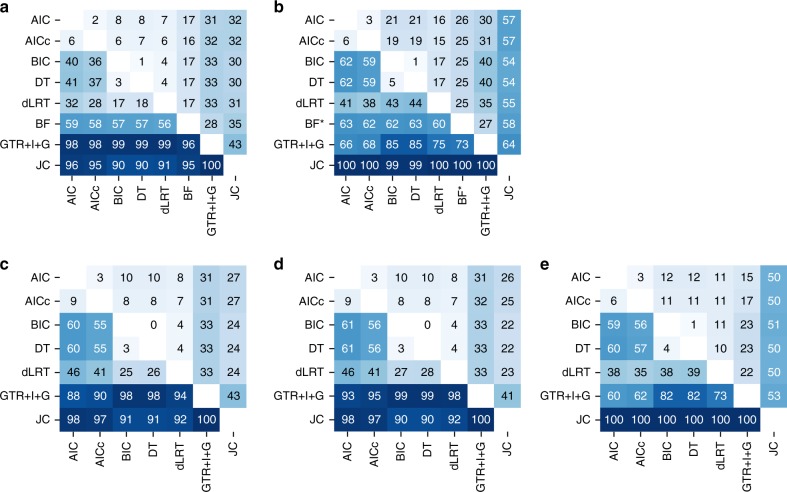
Fig. 1.
Pairwise incongruencies on the trees inferred by the evaluated strategies. The number within each cell represents the percentage of discrepancies between the two strategies at the row and column. The best-fitted model was computed for each criterion, and the trees were reconstructed using ML optimizations according to this model, as well as for the most complex and simplest models—GTR+I+G and JC. For each pair of strategies (rows and columns) the percentage of non-identical trees over 7200 datasets is presented (see * and ** below). The upper right triangles represent the percentages of different topologies and the lower left triangles represent different branch-length estimates. Clearly, two different models lead to different branch-length estimates, hence the latter reflect the percentages of differently selected models. The panels represent the following datasets: a simulation set c0, b the empirical set, c simulation set c1, d simulation set c2, and e simulation set c3**. (*) The percentages in the row and column of the BF criterion in panel b were computed over a subset of 1500 empirical datasets for which BF was computed (marked with an asterisk; see Methods). The analysis over this subset of 1500 datasets for all comparisons is presented in Supplementary Figure 1. (**) The percentages of the simulation set c3 were computed over a subset of 1000 datasets that represent coding sequences (see Methods)

