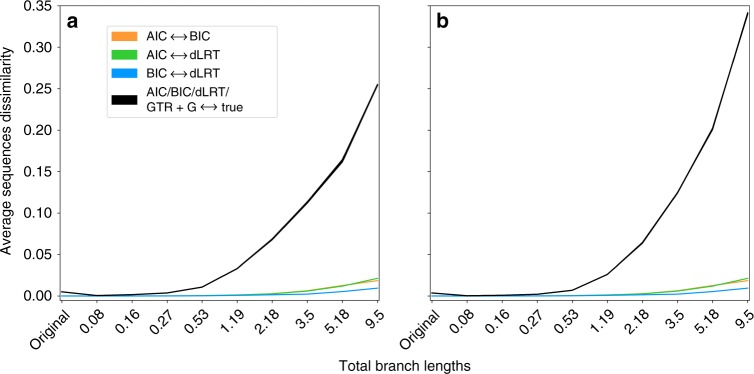
Fig. 2.
The impact of model selection criteria on ancestral sequence reconstruction. The y axis represents the fraction of sequence sites that were different between every pair of root sequences, averaged across 1000 examined datasets: the black curves (which merge due to negligible differences) represent the comparison between the true root sequence and the inferred one according to the models selected by each of the criteria AIC, BIC, and dLRT, or consistently using GTR+G, and the colored curves represent the differences between every pair of criteria. The results of AICc and DT were similar to AIC and BIC, respectively, thus they are not shown. To increase the variety of sequence divergence, the analysis was repeated for trees that were resized to several scales (x axis). The left and right plots represent the analysis on a simulation set c0; b complex simulation set c2. For the numerical estimates, see Supplementary Table 1

