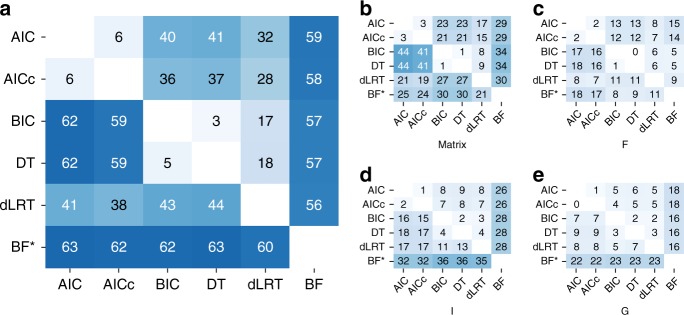
Fig. 3.
Incongruency over the selection of models for the empirical and simulated datasets. The matrices represent the percentage of the 7200 datasets for which a pair of criteria in the corresponding column and row disagreed on. a represents the disagreement over the entire model (one of 24 models) while (b–e) represent disagreement over components of the models: b the substitution matrix that determines the substitution rates between the nucleotides, such that an equal parameter for all pairs defines JC and F81, two rates for transitions and transversions define K2P and HKY, and an independent parameter for each of the six pairs defines SYM and GTR, c the inclusion of the F component, i.e., equal base frequencies represent JC, K2P, and SYM, whereas unequal frequencies represent F81, HKY, and GTR, d the inclusion of the I parameter (proportion of invariable sites), e the inclusion of the G parameter (heterogeneous rates across sites following the gamma distribution). The percentages below and above the left diagonal represent the percentage of dissimilarities over empirical set and simulation set c0, respectively. The percentages in the row of the BF criterion are among a subset of 1500 empirical datasets for which BF was computed (marked with an asterisk; see Methods). The analyses over this subset of 1500 datasets for all pairs of criteria is presented in Supplementary Figure 4

