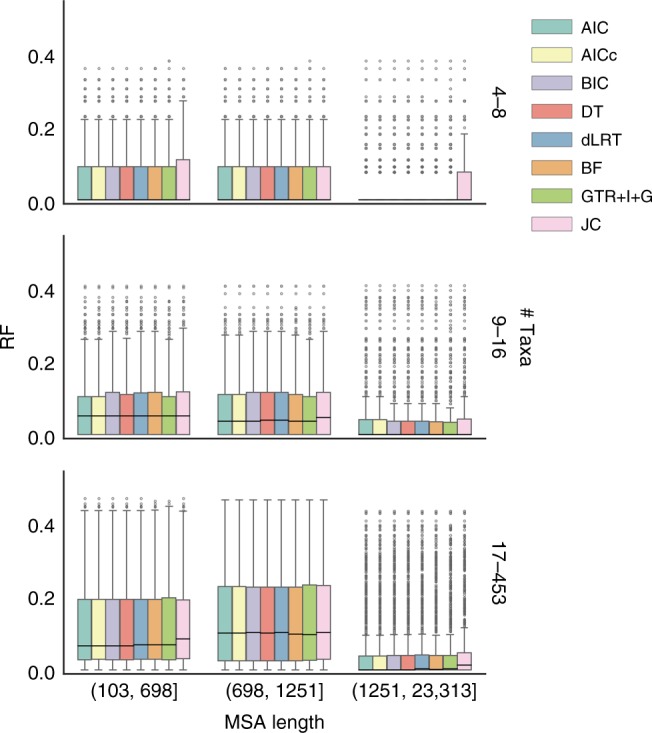
Fig. 4.

RF distances across different alignment sizes for simulation set c0. RF distances (y axes) were measured between trees reconstructed according to every strategy (denoted by the different colors) and the corresponding true trees. The data are binned according to the number of taxa (right-vertical axis) and alignment length (horizontal axis). The RF distances are divided by the number of nodes in the trees for a valid comparison across different tree sizes within a bin. The central horizontal lines represent the median values. The bounds of the boxes represent the first and third quartiles (q1 and q3, respectively). The whiskers extend to (q3−q1) × 1.5 beyond the quartiles
