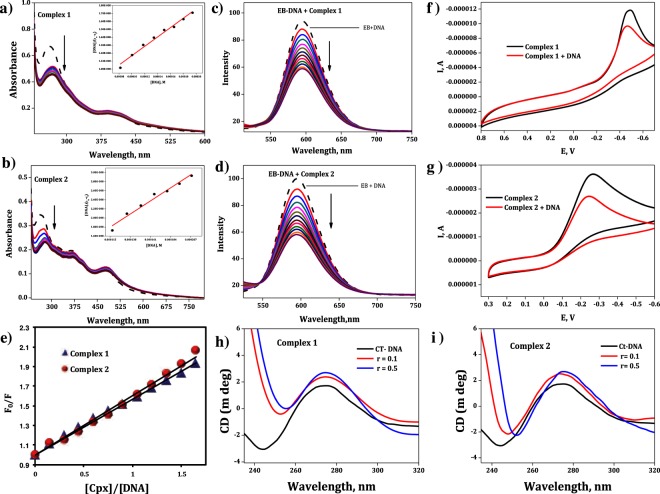
Figure 2.
Electronic absorption spectra of cobalt(III) complexes 1 (a) and 2 (b) in the absence (dashed line) and presence (solid line) of increasing amounts of DNA. Insert: Plot of [DNA]/(εa − εf) vs [DNA]. [Complex] = 2 × 10⁻⁵ M−1, [DNA] = 0–2.1 × 10⁻⁴ M−1. Emission spectra (λex = 450 nm) of EB - DNA: in the absence (dotted line) and in the presence of (solid line) of the complexes 1 (c) and 2 (d). Stern-Volmer (CV) plot (e) of fluorescence quenching of EB - DNA by complexes 1 and 2. Cyclic Voltammetry of complexes 1 (f) and 2 (g) in the absence ( black line) and in the presence (red line) of DNA. Circular dichroism spectra of CT-DNA (4 × 10⁻⁵ M) in the presence of complex 1 (h) and 2 (i), r = [complex]/[DNA] = 0.0, 0.1 and 0.5).

