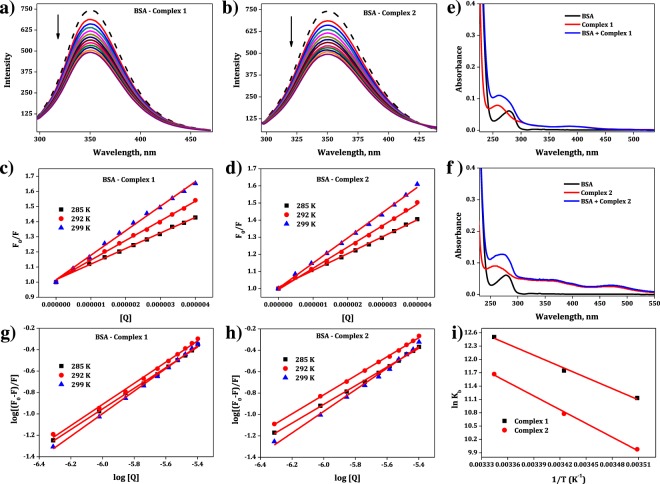
Figure 3.
The fluorescence emission spectra of BSA in the presence of complexes 1 (a) and 2 (b). The dashed line shows the intensity of BSA in the absence of complexes. After addition of the complexes 1 and 2 ([complex] = 0–4 × 10⁻⁶ M; [BSA] = 1.35 × 10⁻⁶ M) to BSA, the emission intensity of BSA was decreased which is indicated by “arrow”. Stern-Volmer plot for quenching of BSA by cobalt(III) complexes 1 (c) and 2 (d). The UV-Vis absorption spectra of BSA and complexes 1 (e) and 2 (f). Plot of log[(F0 − F)/F] vs log [Q] for BSA- cobalt(III) complexes 1 (g) and 2 (h). van’t Hoff plot for the interaction of BSA with complexes 1 and 2 (i).

