Figure 5.
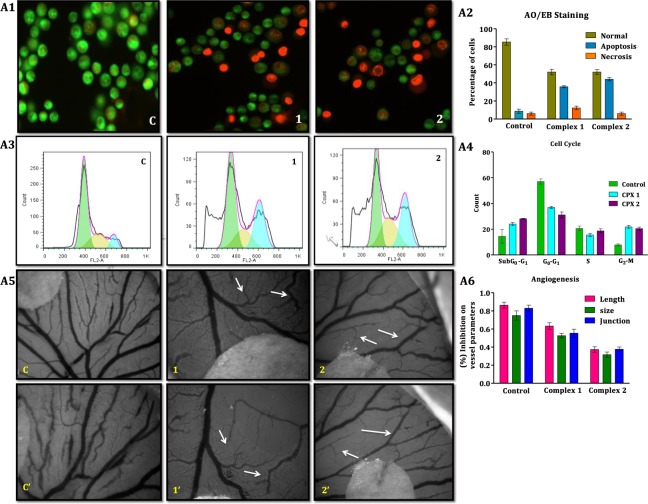
(A1). Morphological assessment of control (A1 c; the cells are viable as inferred from the green fluorescence) and treated (A1, 1 complex 1; & A1, 2 complex 2) A549 lung cancer cells. (A2) The graph shows data on percentage of cells that are normal and those afflicted with apoptosis and necrosis in the control and 24 h treated groups. (A3) The effects of complexes 1 and 2 on the cell cycle progression in lung cancer A549 cells. (A4) The bar diagram displays higher percentage of cells in sub G0 − G1 and G2-M phases after treatment of A549 cancer cells with complexes 1 and 2. The cell cycle distribution was analyzed using Dean-Jett-Fox software and depicted as the histogram. (A5) The vascular sprouting has been damaged (marked by arrows) on exposure to complexes 1 and 2 (10 μM) compared to control at 0 h (C, 1 and 2) after 6 h (C′, 1′ and 2′) of treatment. (A6) The different angiogenic parameters such as vessel length, vessel size and number of junctions decreased on exposure to complexes 1 and 2 compared to control. (Data are expressed in Mean ± SD).

