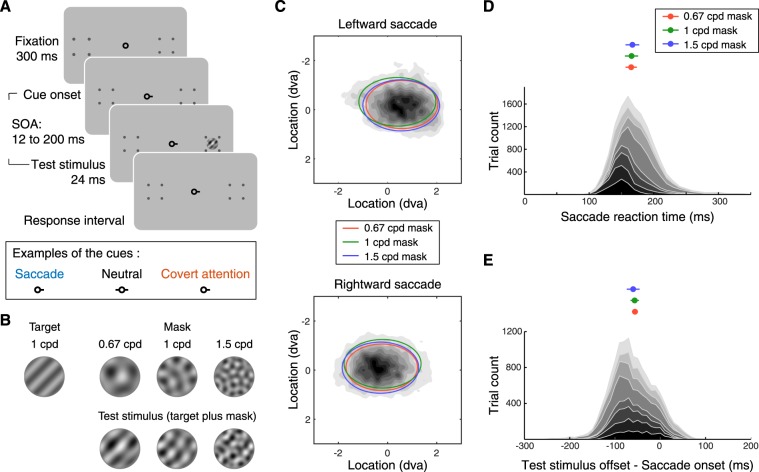
Figure 1.
(A) Experimental procedure. Top row: Each trial started with a 300-ms fixation period, followed by the onset of the cue. The stimulus onset asynchrony (SOA) between the cue onset and stimulus onset was sampled uniformly between 12 to 200 ms. Bottom row: Examples of the cues used in each condition. In the saccade and covert-attention conditions, the cue pointed towards where the test stimulus would be presented. In the neutral condition, the cue pointed towards both locations. (B) Example of stimuli used in Experiment 1. Top row: The target was a 1 cpd grating tilted 45° clockwise or counterclockwise from vertical. The mask had three different SFs. Bottom row: The test stimulus was composed of the target superimposed on the mask. (C) Density of saccade landing position. The dark-gray shading represents group-averaged density of saccade landing position. The ellipses represent group-averaged data from different masking SFs. The ellipses are centered at the mean of saccade-landing positions. The width and height of the ellipses represent 1 standard deviation of (group-averaged) saccade-landing positions along the horizontal and vertical direction. (D) Bottom, distribution of trials sorted by saccade reaction time (delay between cue onset and saccade onset). Each shade of gray represents one individual. Top, group-averaged median saccade reaction time in each condition (masking SF). Error bars represent ± 1 s.e.m. (E) Bottom, distribution of trials sorted by the relative timing between saccade onset and the offset of the test stimulus. Each color represents one individual. Top, group-averaged median latency (relative timing between saccade onset and the test stimulus offset) in each condition (masking SF). Error bars represent ± 1 s.e.m.

