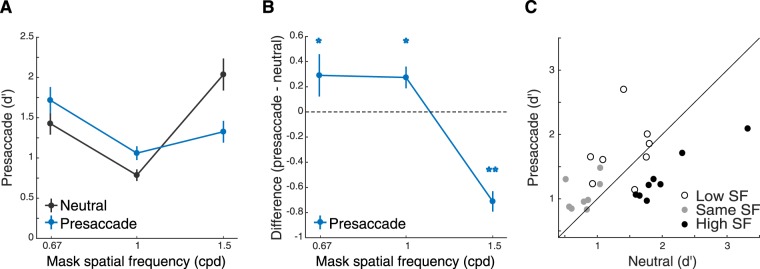
Figure 2.
Experiment 1a. (A) Performance (d′) as a function of mask SFs. Error bars represent standard deviation of the bootstrapped distribution. (B) Difference of d’ between the saccade and neutral conditions. Saccade preparation improved performance for the low- and same-SF masks but decreased it for the high-SF mask. Error bars represent standard deviation of the bootstrapped distribution. *p < 0.05; **p < 0.005. (C) Scatter plot of performance of individual observers for each of the three masking SFs.

