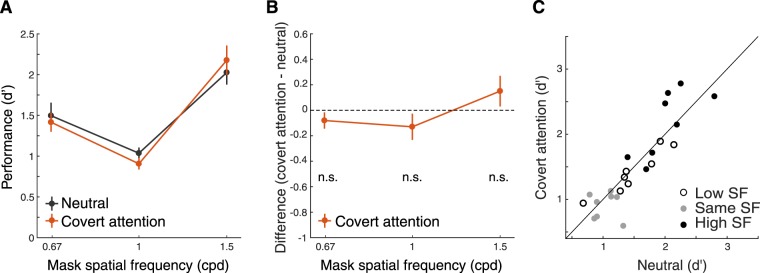
Figure 3.
Experiment 1b. (A) Performance (d′) as a function of mask SFs in the Covert attention (control) experiment. Error bars represent standard deviation of the bootstrapped distribution. (B) Difference of d′ between the covert attention and neutral conditions. Error bars represent standard deviation of the bootstrapped distribution. n.s. = no significant difference. (C) Scatter plot of performance of individual observers for each of the three masking SFs.

