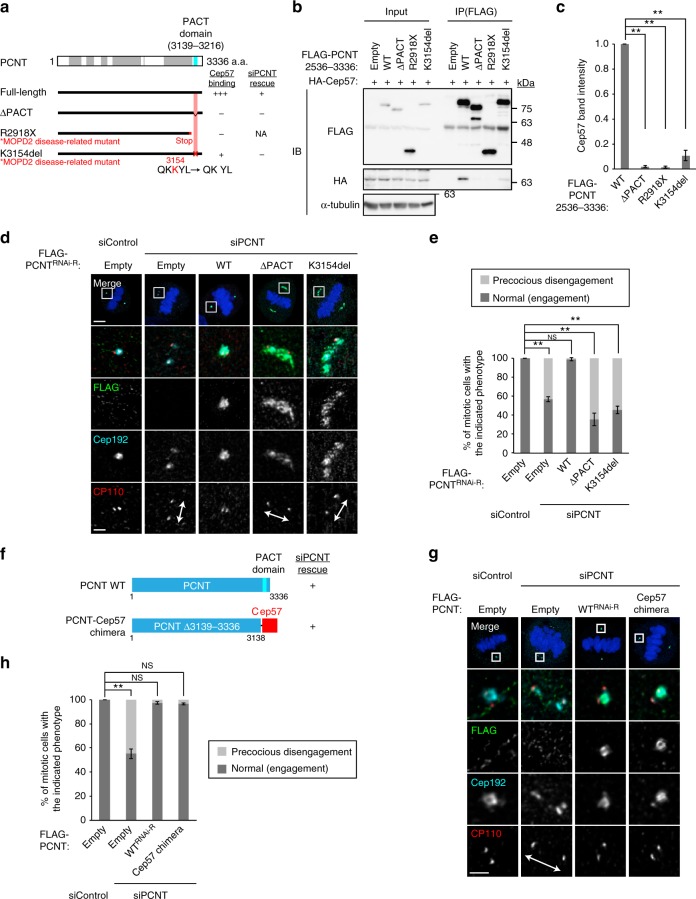
Fig. 5.
The binding of PCNT to Cep57 at centrioles is required for the proper localization pattern of PCNT to organize mitotic PCM. a Schematic of PCNT and the ΔPACT mutant or MOPD2 disease-related mutants used for co-IP assays. Coiled-coil domains are shown in gray box and the PACT domain in blue box. The region of PCNT for Cep57-binding is represented in red. The right columns show a summary of the co-IP results and rescue experiments, respectively. b HEK293T cells co-expressing HA-Cep57 and FLAG-PCNT full-length or the indicated mutants were IPed with FLAG antibodies. c The signal intensity of HA-Cep57 bands in b was quantified. Values are mean ± s.d. from three independent experiments. Tukey’s multiple comparisons test was used to obtain p value. *p < 0.05; **p < 0.01; NS not significantly different (p > 0.05). d HeLa cells were treated with siControl or siPCNT, followed by transfection with FLAG empty (control), RNAi-resistant (RNAi-R) PCNT or the indicated mutants. The cells were immunostained with antibodies against FLAG (green), Cep192 (cyan) and CP110 (red). e Histograms represent frequency of mitotic cells with the indicated phenotypes observed in d in each condition. Values are mean percentages ± s.d. from three independent experiments (n = 50 for each experiment). f Schematic of PCNT and the PCNT-Cep57 chimera mutant used for PCNT knockdown and rescue experiments. g HeLa cells were treated with siControl or siPCNT, followed by transfection with FLAG empty (control), RNAi-resistant PCNT, or the PCNT-Cep57 chimera mutant. The cells were immunostained with antibodies against FLAG (green), Cep192 (cyan), and CP110 (red). h Histograms represent frequency of mitotic cells with the indicated phenotypes observed in g in each condition. Values are mean percentages ± s.d. from three independent experiments (n = 50 for each experiment). All scale bars, 5 μm in the low-magnified view, 1 μm in the inset. Left–right arrows indicate precociously disengaged centrioles. Tukey’s multiple comparisons test was used in e and h to obtain p value. *p < 0.05; **p < 0.01; NS not significantly different (p > 0.05)

