Figure 1.
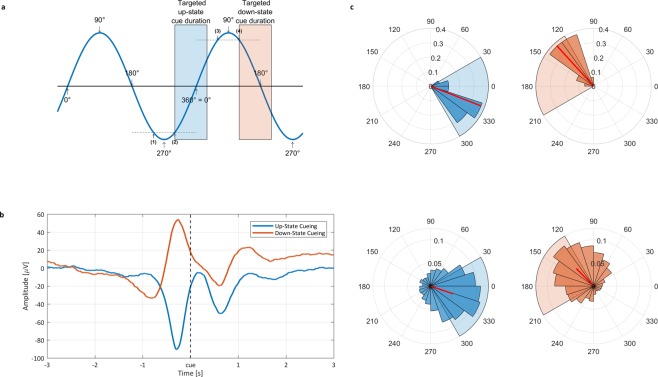
Closed-loop TMR algorithm evaluation. (a) Schematic overview of the slow-wave detection algorithm and the targeted areas for up-state TMR (blue) and down-states TMR (red). (b) The ERP-analyses revealed that up-state cues were located at the down-to-up transition of the cortical slow wave (beginning of slow oscillatory up-state), and that down-state cues were played at the up-to-down transition (beginning of slow oscillatory down-state). (c) Phase angle at stimulus release. The top row illustrates the angles averaged at subject level, the bottom row shows results on trial level (red and blue shading corresponds to targeted areas in a). The left column indicates the up-state phases, while the right column shows the down-state phase angles. All data is shown for electrode Fz.

