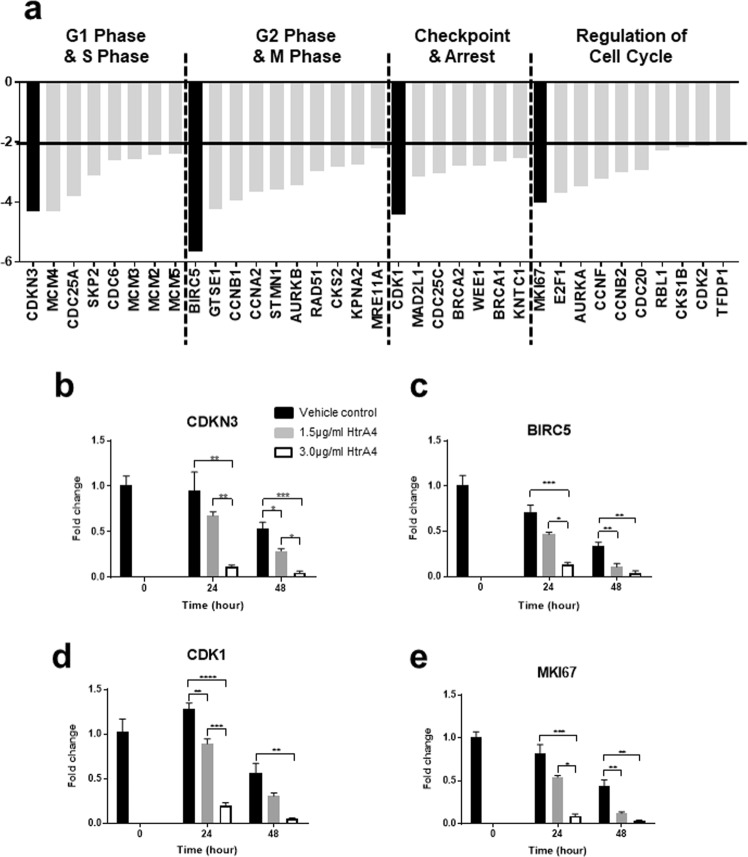
Figure 2.
HtrA4 suppresses HUVEC mRNA expression of cell cycle genes. (a) Summary of PCR array analysis of 84 cell cycle genes. RNA from cells treated with vehicle control or 3.0 μg/ml HtrA4 for 24 h were pooled from 3 independent experiments and applied to the array. Data is expressed as HtrA4-induced fold changes relative to the vehicle control, and 35 genes that displayed a greater than 2-fold reduction in expression are categorised into four groups. These 35 genes were further validated by real-time RT-PCR, data of those represented in black bars are shown in (b-e) and the remainder are shown in Supplementary Fig. 1A–D. (b–e) Real-time RT-PCR validation of the four genes that showed the greatest changes in each category on the array. (b) CDKN3, (c) BIRC5, (d) CDK1 and (e) MKI67. Cells were treated with 1.5 μg/ml or 3.0 μg/ml HtrA4 for 0, 24 or 48 h, n = 3. Data is expressed as mean ± SD. *p < 0.05, **p < 0.01, ***p < 0.001, ****p < 0.0001.

