Figure 6.
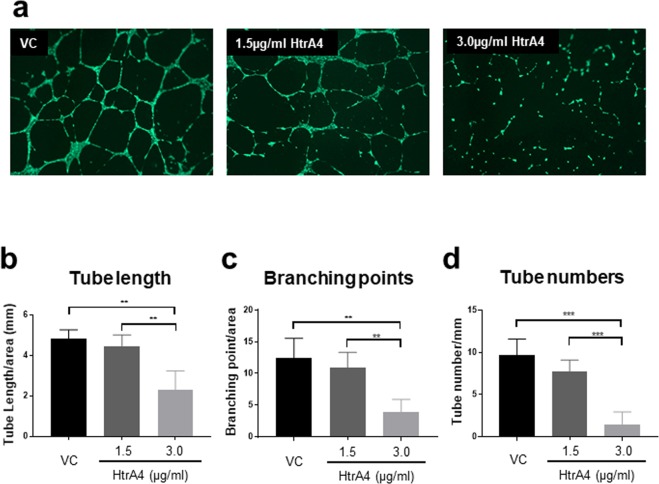
HtrA4 disrupts tube formation in EPCs. Cells were treated with vehicle control or two concentrations of HtrA4, and their abilities to form tubes were assessed. Four independent EPC clones were examined. (a) Representative images at 4x magnification. (b–d) Quantification of tube formation. (b) Total tube length per mm2 area, (c) Total branching point per mm2 area, and (d) Number of tubules per mm2 area. n = 4 for all. Data are expressed as mean ± SD. **p < 0.01, ***p < 0.001.

