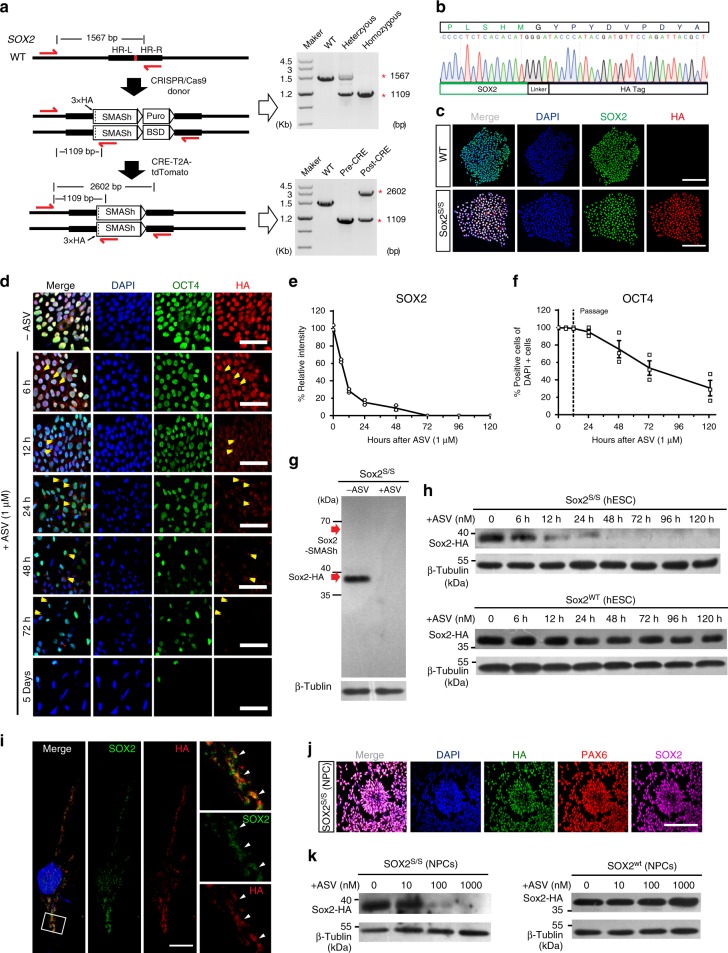
Fig. 2.
Tracking and dosage control of endogenous SOX2 in hPSCs. a Generation of SOX2s/s hPSC lines using CRISPR and PCR genotype of a positive colony. b Sanger sequencing of a representative SOX2s/s hPSC colony shows integration of HA-SMASh fragment. c Immunostaining for SOX2 (green) and HA (red) in H9-SOX2s/s and WT H9 hESCs. Scale bar, 100 μm. d, f Immunostaining for OCT4 (green), HA (red) (d) and quantification (f) (n = 3 experimental replicates) of OCT4+ cells of H9-SOX2s/s hESCs upon treatment with ASV (1 μM) showing degradation of endogenous SOX2 and declining of OCT4-expressing cells. Yellow arrow heads show the protein aggregates. Scale bar, 50 μm. Dashed line indicates the time of passage. e, h Western blot of H9-SOX2s/s and WT H9 hESCs after ASV treatment for 5 days (h) and intensity analysis (e) (n = 3 experimental replicates) shows ASV (1 μM) shuts off of endogenous SOX2 in H9-SOX2s/s hESCs. g Western blot of H9-SOX2s/s hESCs showing efficient cleavage between SOX2 and SMASh without ASV and efficient degradation of SOX2 by SMASh upon administration of ASV (1 μM). In either case, no SOX2-SMASh fused protein exists. i Immunofluorescence images show aggregates of endogenous SOX2 protein after 48 h treatment of ASV (1 μM). White arrow heads indicate the co-localization of SOX2 (green) and HA (red). Right, zoom of the rectangle. Scale bar, 10 μm. j Immunostaining for PAX6 (red), SOX2 (magenta), HA (green) in H9-SOX2s/s hESCs derived cortical neuronal progenitor cells (NPCs). Scale bar, 100 μm. k Western blotting showing that SOX2 protein level was dose dependently controlled by ASV in NPCs derived from H9-SOX2s/s or wild type H9 hESCs. All error bars represent mean ± s.e.m. Source data are provided as a Source Data file

