Fig. 6.
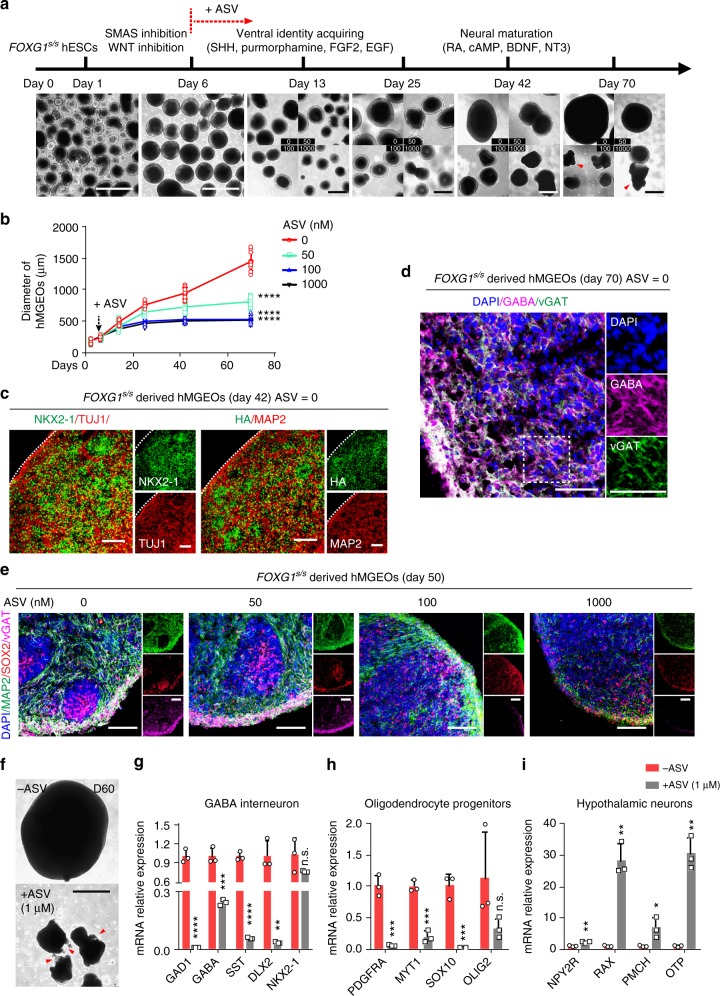
FOXG1 biphasically regulates GABA interneuron in hPSC-derived MGE organoids. a Schematic overview and bright field images of MGE organoids in different stages of differentiation. ASV treatment was started from day 6. Red arrow heads indicate shattered hMGEOs. Scale bar, 500 μm. b Quantification of the organoids’ sizes (n = 10 experimental replicates) from panel a. Dashed arrow indicates ASV treatment start time. ****p < 0.0001. Two-way ANOVA and Tukey’s multiple comparisons test. c Representative immunofluorescence images for NKX2-1 (left, green), TUJ1 (left, red), FOXG1-HA (right, green), MAP2 (right, red) of FOXG1s/s derived hMGEOs on day 42, ASV = 0. Scale bar, 100 μm. d Representative immunofluorescence images for mature GABA interneuron markers vGAT (green), GABA (magenta) of FOXG1s/s derived hMGEOs on day 70, ASV = 0. Right, zoom of dashed rectangle. Scale bar, 50 μm. e Representative immunofluorescence images for MAP2 (green), SOX2 (red), vGAT(magenta) of FOXG1s/s derived hMGEOs from each ASV treatment group (0, 50, 100, and 1000 nM)) on day 50. Scale bar, 100 μm. f Representative bright field image of a hMGEO from ASV = 0 group and ASV = 1000 nM group on day 60. Red arrow heads indicate shattered hMGEOs. Scale bar, 500 μm. g–i qPCR analysis (n = 3 biological replicates) on the ASV = 0 and ASV = 1000 group at day 60 for GABA interneuron related genes (g), oligodendrocyte progenitor cells related genes (h) and hypothalamic neuron relate genes (i). *p < 0.05, **p < 0.01, ***p < 0.001, ****p < 0.0001 and n.s. not significant. Data were subjected to an unpaired two-tailed t test. All error bars represent mean ± s.e.m. Source data are provided as a Source Data file

