Fig. 7.
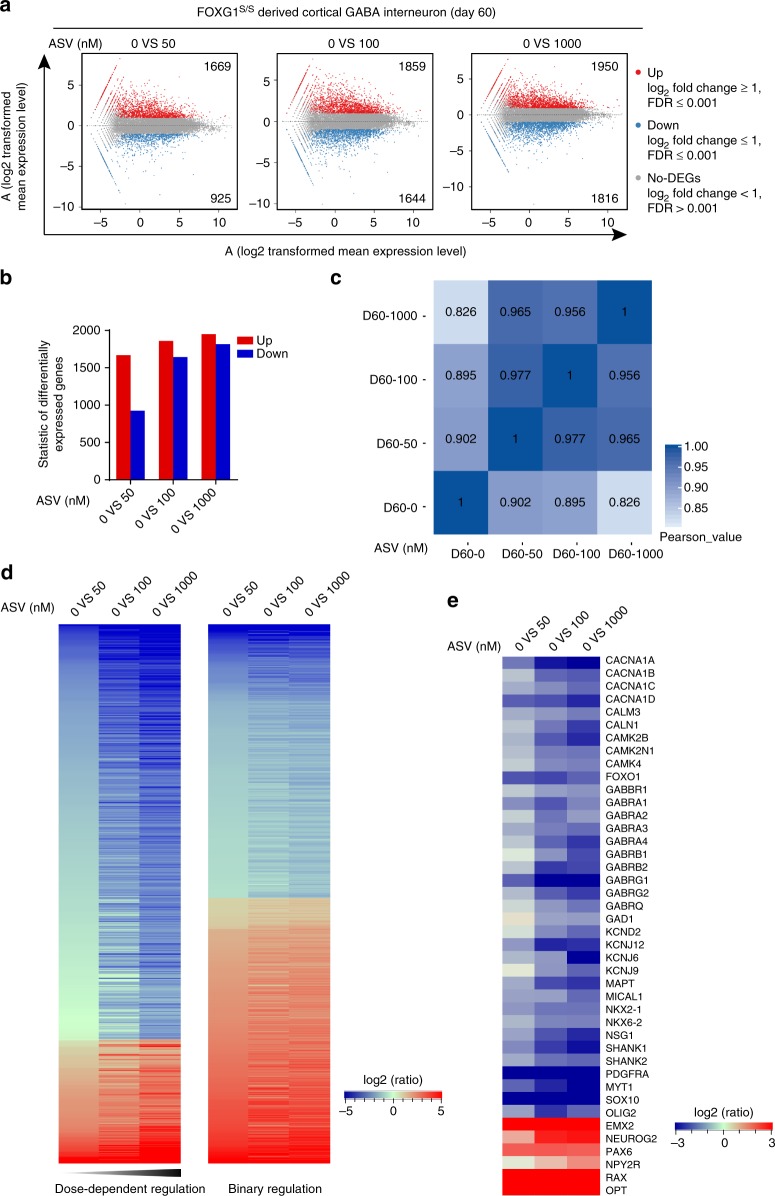
RNA-seq analysis of cortical GABA interneurons derived from hESCs with different FOXG1 dosage. a MA plots chart of differentially expressed genes (DEGs) compared to FOXG1 (ASV = 0) group. Red, blue and gray dots represent up-regulated, down-regulated DEGs and non-DEGs. b DEGs between each ASV treated and the untreated FOXG1 (ASV = 0) group. c Correlation heatmap showing weaker correlation between FOXG1 discriminated groups. d Expression profile presenting of two different clusters of DEGs. Left shows dose-dependent regulation by FOXG1, while right shows binary regulation by FOXG1. Coloring indicates the log2 transformed fold change. e Expression profile of key genes related to GABA neuron development and GABAergic synapses formation. Coloring indicates the log2 transformed fold change

