Fig. 8.
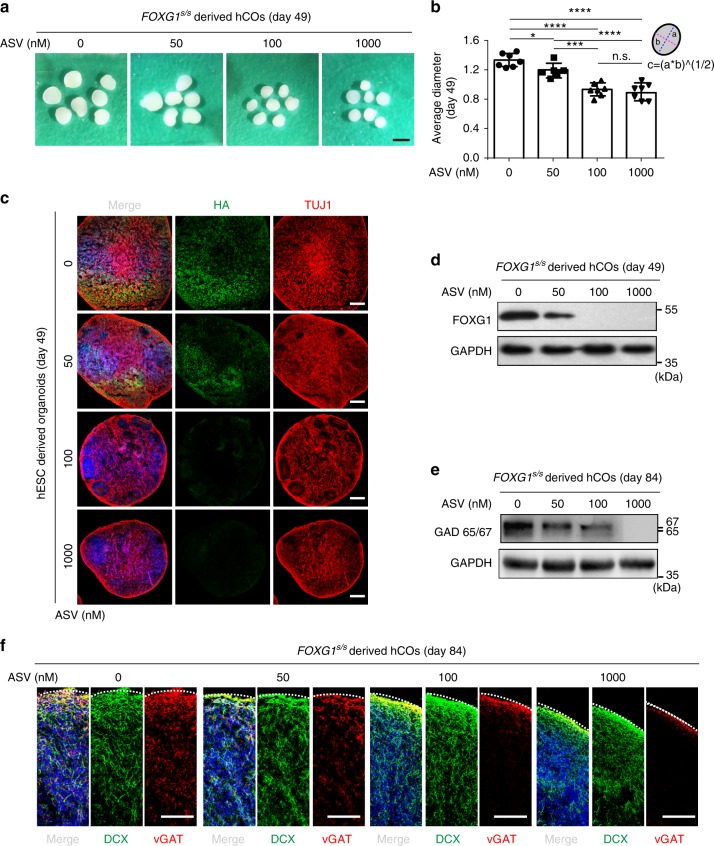
Model FOXG1 syndrome in hPSC-derived cortical organoids using SMASh. a Representative images of FOXG1s/s hESCs derived hCOs on day 49 under the treatment of different concentration of ASV (0, 50, 100, and 1000 nM). Scale bar, 1 mm. b Quantification of the average diameter of the organoids on day 49. a, long semi-axis; b, short semi-axis. Average diameter c = 2*(a*b)^(1/2). Data are presented as dot plots of individual experiments. *p < 0.05, ***p < 0.001, ****p < 0.0001 and n.s. not significant. One-way ANOVA and Tukey’s multiple comparisons test. c Representative immunofluorescence images of organoids from each ASV treatment group (0, 50, 100, and 1000 nM) for HA (green), TUJ1 (red). Scale bar, 200 μm. d Western blot of FOXG1s/s hESCs derived hCOs on day 49 to detect FOXG1-HA. e Western blot of FOXG1s/s hESCs derived hCOs on day 84 to detect GAD65/67, showed decreasing of GAD65/67, as shutting off FOXG1 protein production. f Representative immunofluorescence for GABA interneuron maker vGAT (red) and neuronal maker DCX (green) in FOXG1s/s hESCs derived hCOs on day 84. Scale bar, 100 μm. All error bars represent mean ± s.e.m. Source data are provided as a Source Data file

