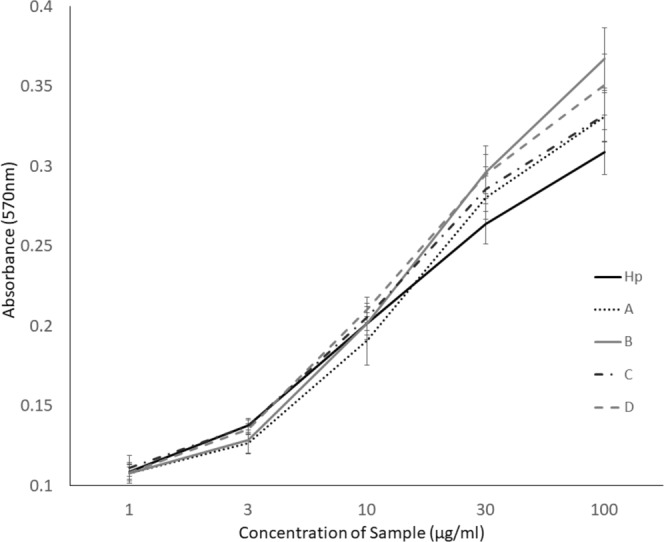
Figure 7.

Proliferation of BaF3-1c cells was induced by Hp or by-products in response to FGF2. Cells were incubated in the presence of 0.1 nM FGF2 and a range of by-product samples or Hp control (1–100 µg/ml) for 72 hours. Proliferation was determined by MTT assay, reading the absorbance at 570 nm (n = triplicate of 3 biological repeats). The mean and standard error for each sample was calculated and multiple t-tests (p = 0.05) were carried out for all repeats, at all concentrations and samples were compared to Hp. P-values with a significant increase over Hp – 100 µg/ml A, 0.002, B, <0.0001, C, 0.002, D, <0.0001, 30 µg/ml A, 0.005, B, <0.0001, C, 0.0006, D, <0.0001, 10 µg/ml D, 0.01. P-values with a significant decrease below Hp – 3 µg/ml A, <0.0001, B, 0.002.
