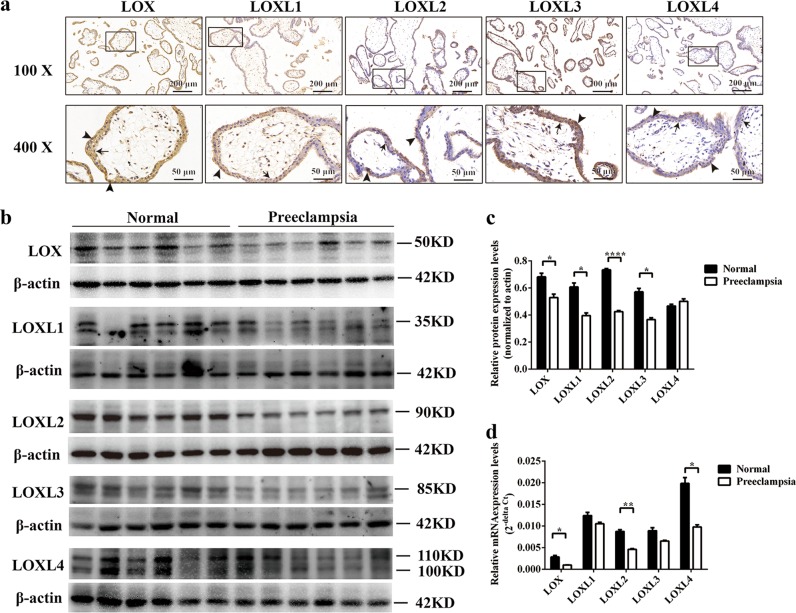
Fig. 1. Decreased expression of LOX and LOXL2 was found in preeclamptic placentas.
a Representative images of expression and localization of LOX family members in first trimester villi by immunohistochemistry analysis. Brownish color represents positive staining of LOX family members. Arrows, trophoblasts; arrowheads, cytotrophoblasts. b Western blot analysis of LOX family members in placentas from normal full-term pregnancies and preeclampsia patients. c Statistical analysis of protein densitometry quantification of western blot analysis (b) by Student’s t-test. Data are presented as the means ± SEM. d mRNA expression of LOX family members was analyzed by quantitative reverse-transcription PCR. Statistical data were analyzed by Student’s t-test. Data are presented as the means ± SEM. *P < 0.05; **P < 0.01; and ****P < 0.0001

