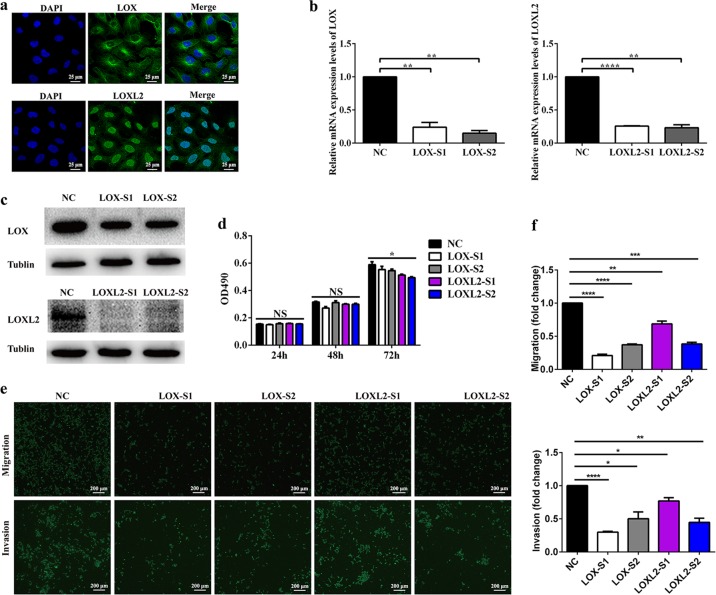
Fig. 2. Knockdown of LOX or LOXL2 decreased trophoblast cell migration and invasion.
a Immunofluorescence staining for LOX and LOXL2 in HTR-8/SVneo cells. Confocal microscopy images were shown. Scale bar = 25 μm. b mRNA expression of LOX and LOXL2 in HTR-8/SVneo cells transfected with LOX siRNA, LOXL2 siRNA, or negative control siRNA was analyzed by quantitative reverse-transcription PCR. c Western blot analysis of LOX and LOXL2 protein expression in HTR-8/SVneo cells transfected with LOX siRNA, LOXL2 siRNA, or negative control siRNA. d Proliferation of HTR-8/SVneo cells lines detected by MTS assays. Statistical analysis of cell proliferation index was performed by one-way analysis of variance. e HTR-8/SVneo cell migration and invasion were determined by Transwell assays. Representative images are shown. f Relative fold changes in cell migration and invasion were calculated. Statistical data were analyzed by Student’s t-test. All data are presented as the means ± SEM of five independent experiments. *P < 0.05; **P < 0.01; ***P < 0.001; ****P < 0.0001; and NS not significant

