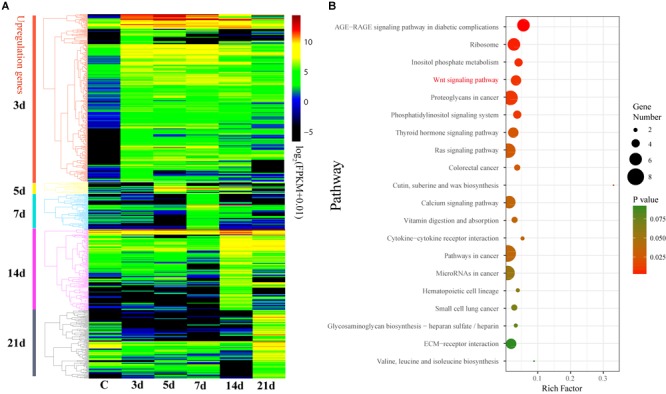
FIGURE 4.

Differential expression analysis of genes during intestinal regeneration. (A) Expression profiles of the DEGs at different intestinal regeneration time points: 0 (C), 3 day (3d), 5 day (5d), 7 day (7d), 14 day (14d), 21 day (21d). DEGs are divided into five groups that significantly expressed at 3d (3d versus C), 5d (5d versus 3d), 7d (7d versus 5d), 14d (14d versus 7d), and 21d (21d versus 14d). (B) Significantly enriched pathways of DEGs that significantly upregulated at 3d. RichFactor is the ratio of the number of DEGs in this pathway term to the number of all genes in this pathway term.
