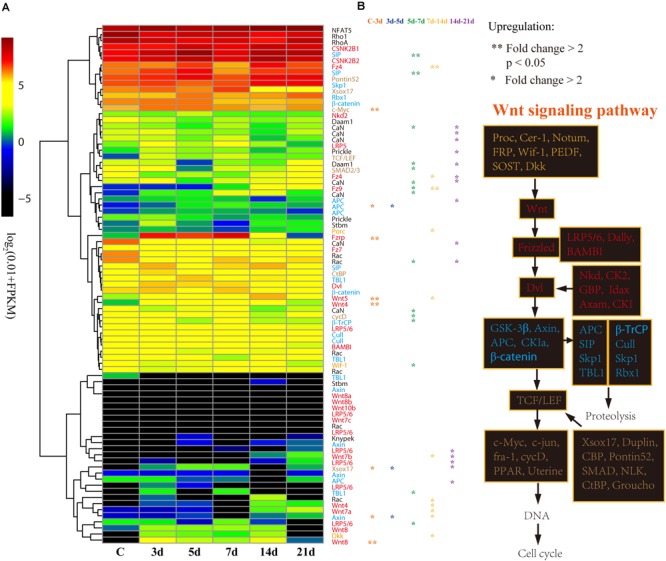
FIGURE 5.

Differential expression analysis of Wnt signaling pathway genes. (A) Expression profiles of the DEGs at different intestinal regeneration time points: 0 (C), 3 day (3d), 5 day (5d), 7 day (7d), 14 day (14d), 21 day (21d). Genes with different colors are correspondent to the color of genes in the plot B. (B) Genes involved in Wnt signaling pathway. Genes from upstream to downstream of the Wnt signaling pathway are in different color.
