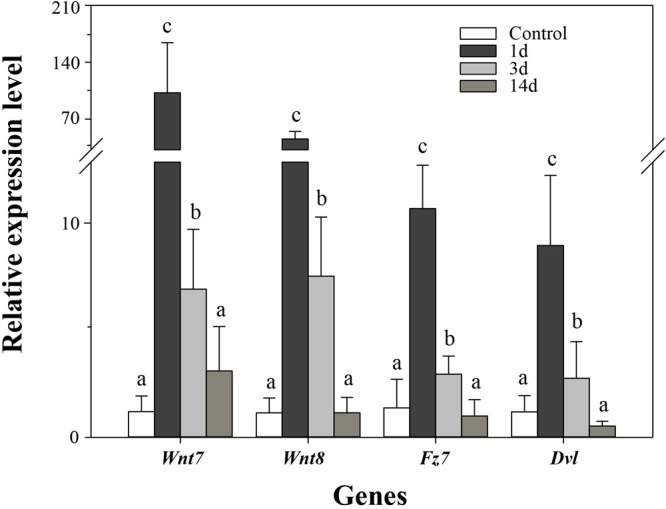
FIGURE 6.

Real-time PCR analysis of four genes during intestinal regeneration. Normal tissues of the intestine were treated as the control group. The values were normalized against NADH. Data are the mean ± standard deviation of the triplicate experiments. Different lowercase letters indicate significant differences (p < 0.05).
